Transcripts (in conjunction with diagnostic tests)
By linking the results of diagnostic test responses to the gradebook, the results can be visualized in numerical and graphical form.
We can assess and analyze each individual's aptitudes and tendencies according to their personalities and strengths, and deepen our understanding of them.
こちらでは、診断テストを自分で作成した場合とテンプレートから作成した場合に分けて、ご説明します。
Create a score chart
診断テストを既に作成した前提で、ご説明します。
Linkage between diagnostic tests and transcripts
01. Open the score chart
On the Manage content, select a course you created and click "+" icon > Score chart
02. Basic Information Settings
Clicking on the gradebook will open the "Gradebook Settings" window, where you can configure the settings.
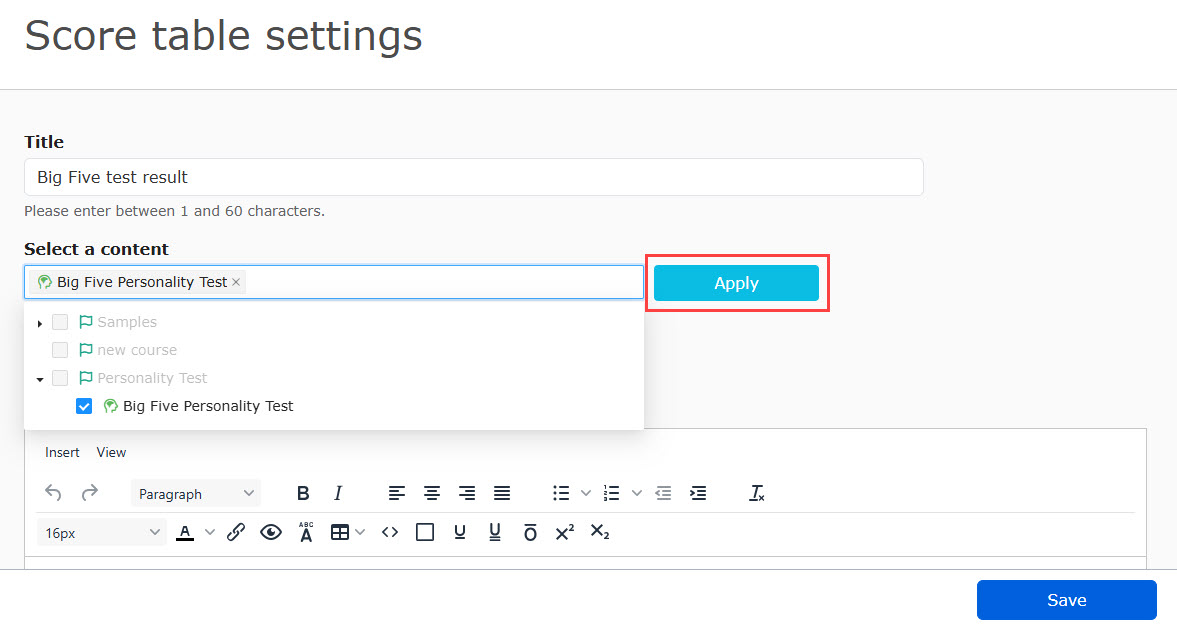
まずはタイトルを入力し、次に「コンテンツ選択」で作成した診断テストを選択します。
選択が完了したら、「コンテンツを決定」をクリックしてください。
「コンテンツを決定」をクリックすると、下記の項目が表示されます。
- 規定回答数
規定回答数とは、成績結果を表示するために必要な回答数のことです。
※設定した回答数に満たない場合、成績表に結果が表示されません。 - help
成績表の中に、ヘルプページを追加できます。
学習画面に(?)のアイコンが追加され、クリックすると作成したヘルプページが表示されます。 - Additional CSS
ヘルプページに、独自のCSSを追加できます。
Adding Panels
パネルとは、診断テストの結果を数値化し、その数値を文章やグラフにして1つの枠で見やすく表示する機能(表示パーツ)です。パネルは、「行を追加」>「パネルを追加」ボタンをクリックして追加します。
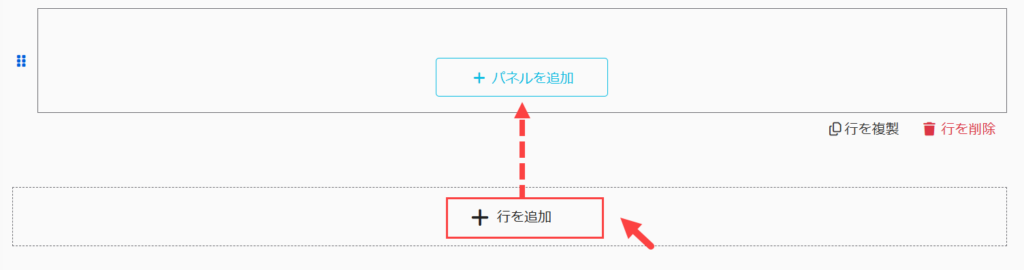
パネルは、1つの行の中に2つまで登録できます。
設定可能なパネルの種類は、下記の通りです。
- Heading panel
- Table panel
- Graph panel
- Summary panel
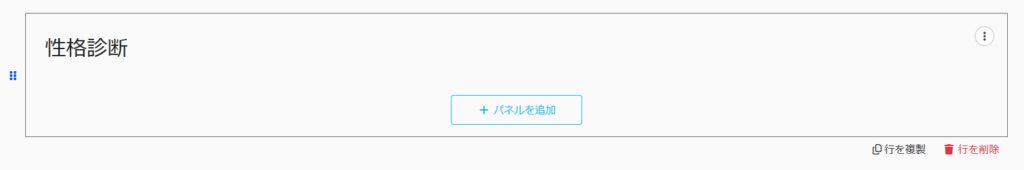
Heading panel
Adding a heading panel allows you to add headings in the gradebook.
Panel Basic Information
詳細については、各パネルの「パネルの基本情報」で行います。
「見出し」に任意の見出しを入力し、「文字サイズ」のプルダウンでサイズを設定できます。
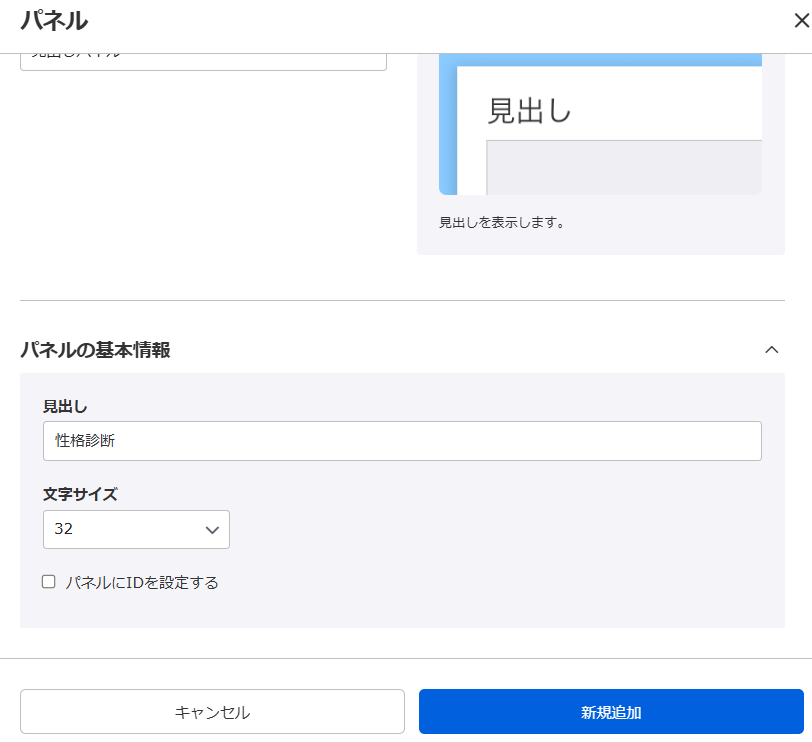
If you tick the "Set ID for panel" box, an ID will be assigned automatically. By using this ID, it will be easier to identify data when acquiring response data through API linkage.
To use the API linkage, you must have the learningBOX paid option ".CustomizationYou are required to sign up for the
Table panel
User response results can be categorized and tabulated according to the characteristic tags you set.
また、集計されたデータは、合計値の数値に合わせて分析結果を出し分けることも可能です。
The results of the diagnostic test are analyzed using the characteristic tags set for the questions.
*Characteristic tags are labels used in diagnostic test questions.
設定できるパネルの種類は、下記の通りです。
- Results of Diagnostic Test Responses
- Characteristic tag analysis results
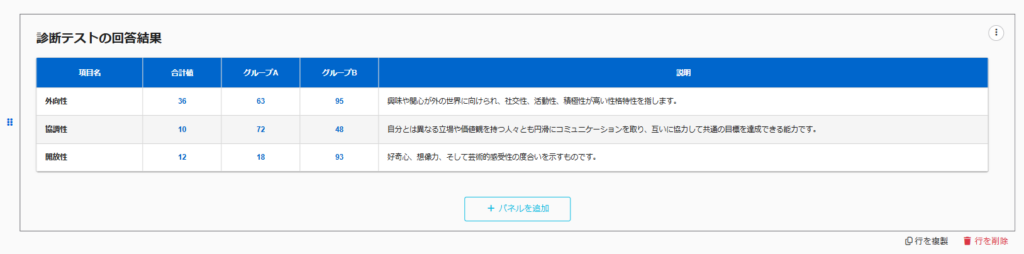
▼Results of Diagnostic Test Responses
The results of the diagnostic test responses are tabulated by characteristic tag and displayed in a table.
The contents associated with the basic information/characteristic tags are reflected as follows.
*If the item name is left blank, the name of the traits
tag will be displayed.
Panel Basic Information
For diagnostic results,Third-party evaluationThe "total value/self-mean value/deviation value/percentage (%)" of each group can be compared.
*One other person's evaluation and up to two groups can be displayed.
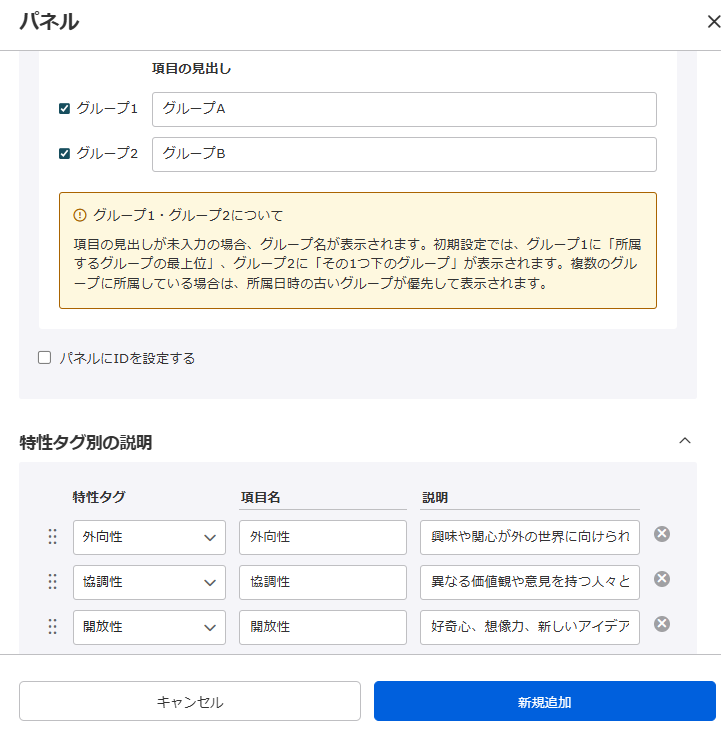
▼ Characteristic tag analysis results
診断テストの結果を、特性タグごとにテーブルに表示できます。
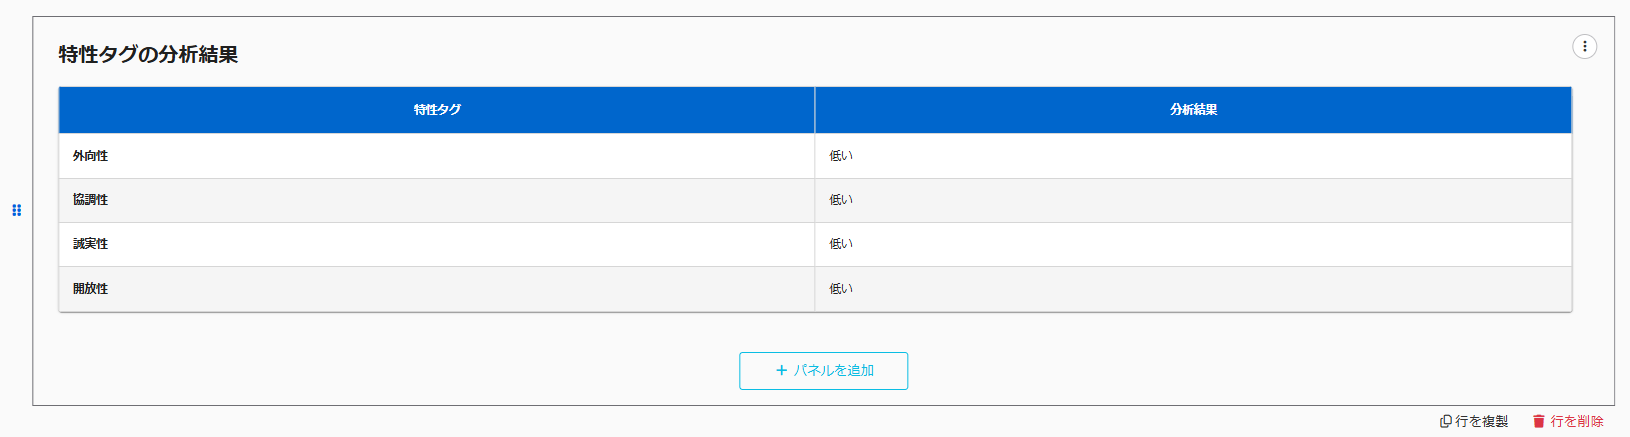
Panel Basic Information
特性タグの合計値によって、分析結果を変更することができます。
複数の特性タグを使って評価を行い、「数値タイプ」のプルダウンにある「合計値/自己平均値/偏差値/割合(%)」に応じたコメントを表示できます。
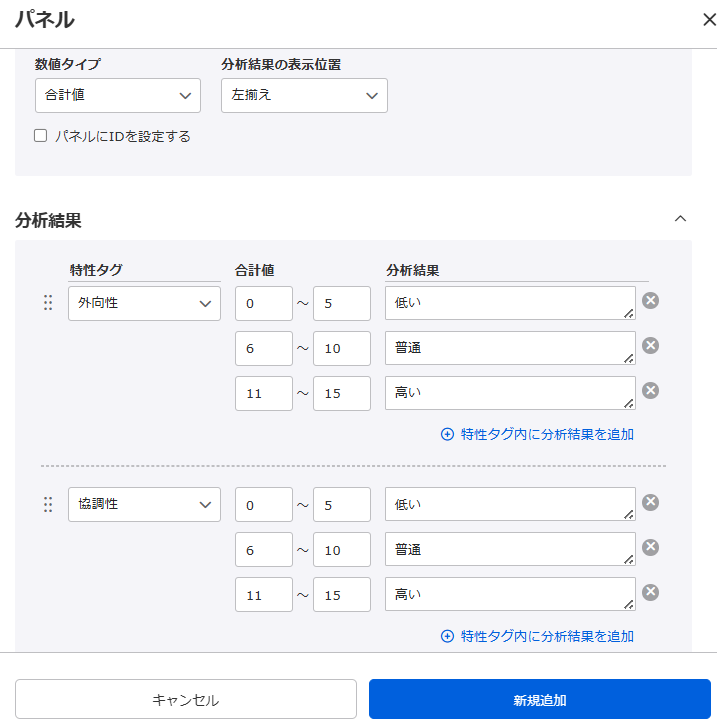
項目名や表示順は、変更可能です。
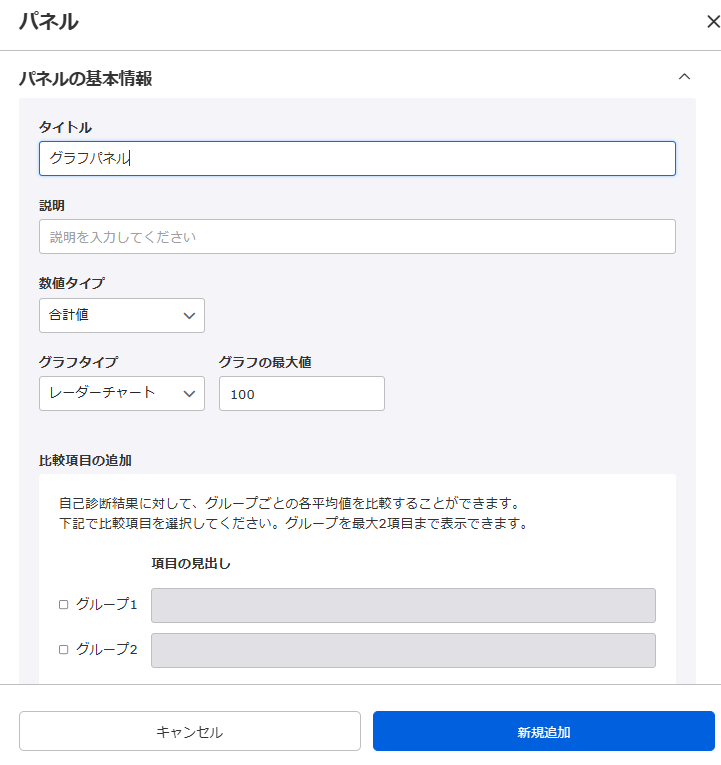
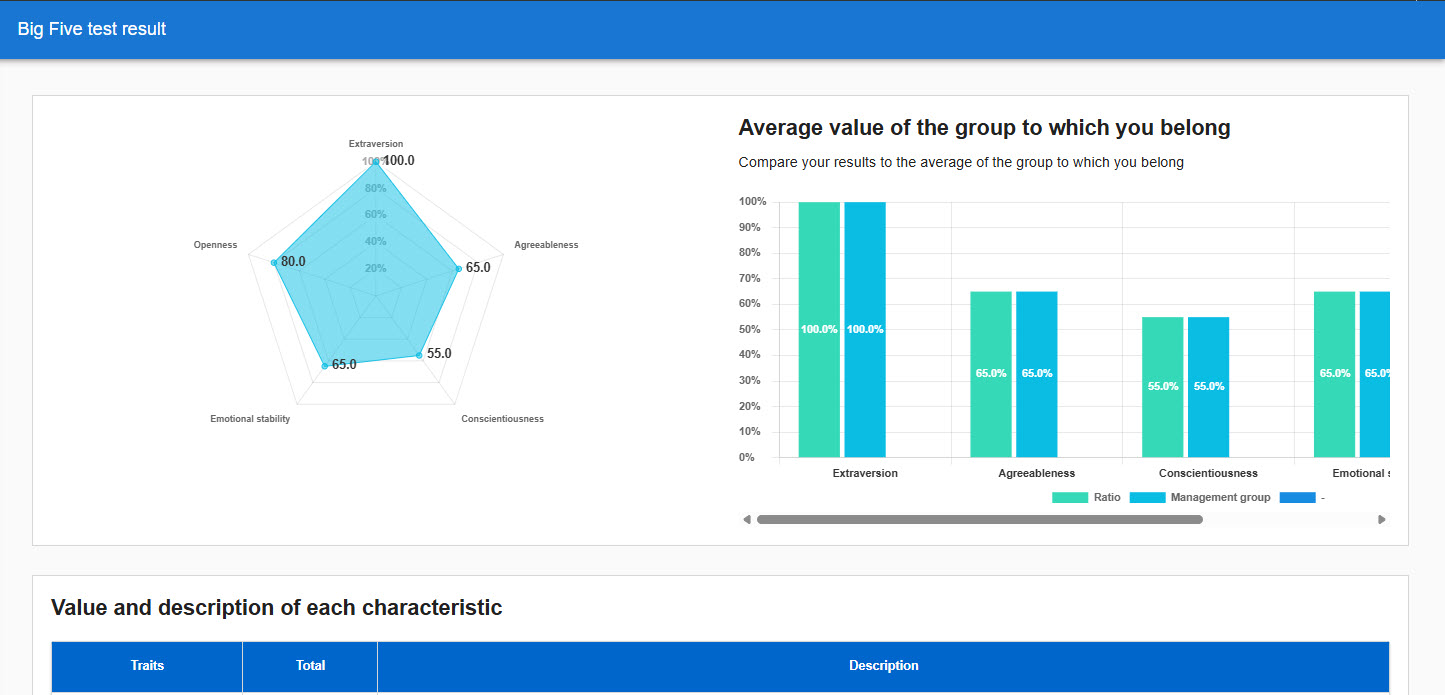
Graph panel
The results of the diagnostic test are tabulated by characteristic tag and displayed in a graph.
The graph can be selected from two patterns: a radar chart and a bar chart.
*If the item name is left blank, the name of the traits
tag will be displayed.
Panel Basic Information
For diagnostic results,Third-party evaluationThe average of each group can be compared.
*One other person's evaluation and up to two groups can be displayed.
Summary panel
The results of the personality test will be shown in text for each trait tag.
You can also change what is displayed depending on the total value of the characteristic tag.
*The maximum number of characters that can be displayed is 3000.
設定できるパネルの種類は、下記の通りです。
- Characteristic tag analysis results
- Minimum/maximum value of characteristic tag
- Combination of characteristic tags
- Judgment result of multiple characteristic tags
▼ Characteristic tag analysis results
The results of the diagnostic test are displayed in text for each characteristic tag, the content of which can be changed according to the total value of each characteristic tag.
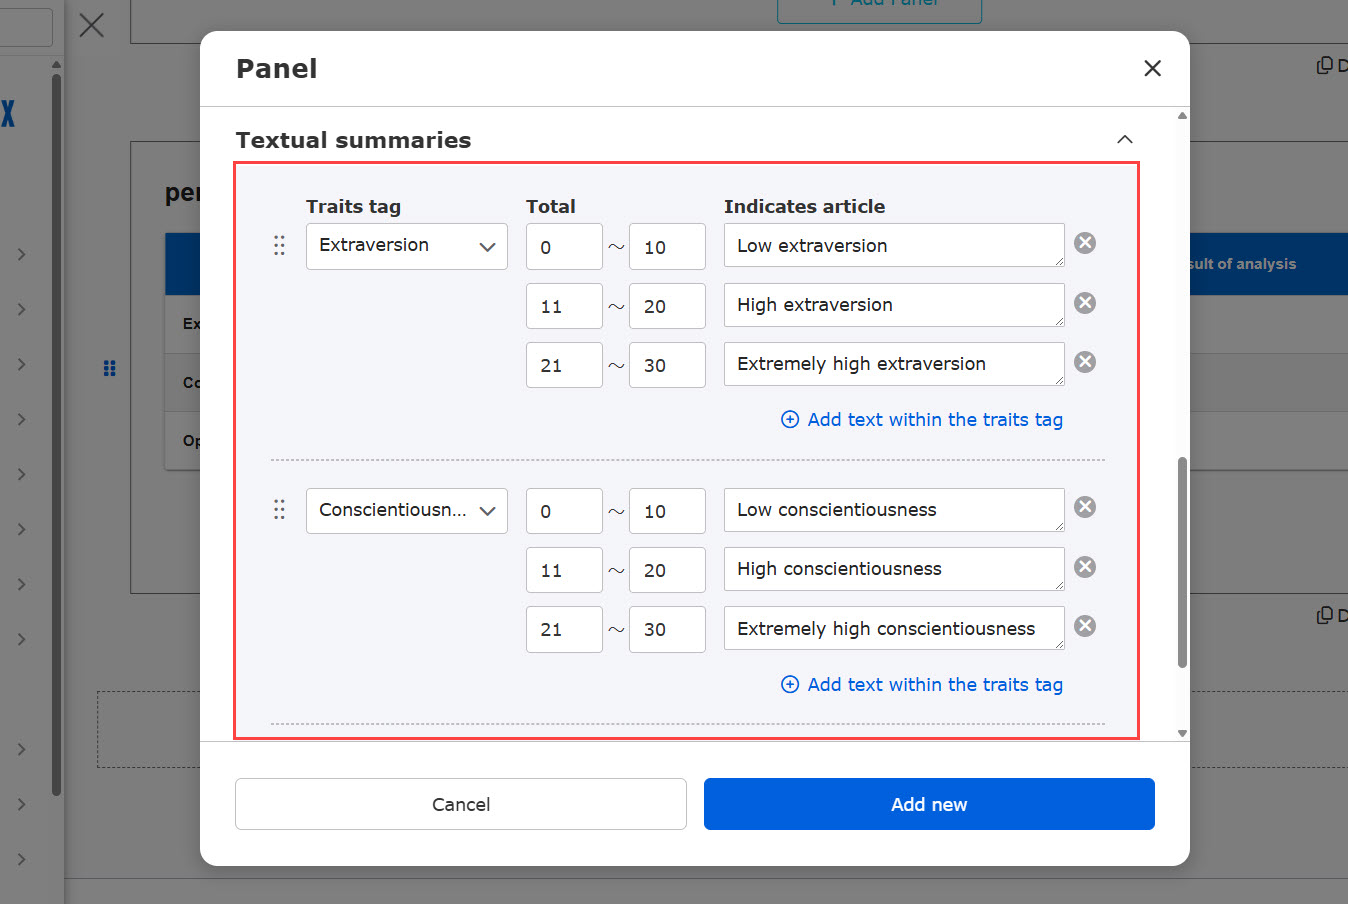
▼Minimum of characteristic tags /Maximum value
Multiple traits tags can be set.
According to the result, different description will be displayed.
The maximum number of characteristic tags that can be set is 100.
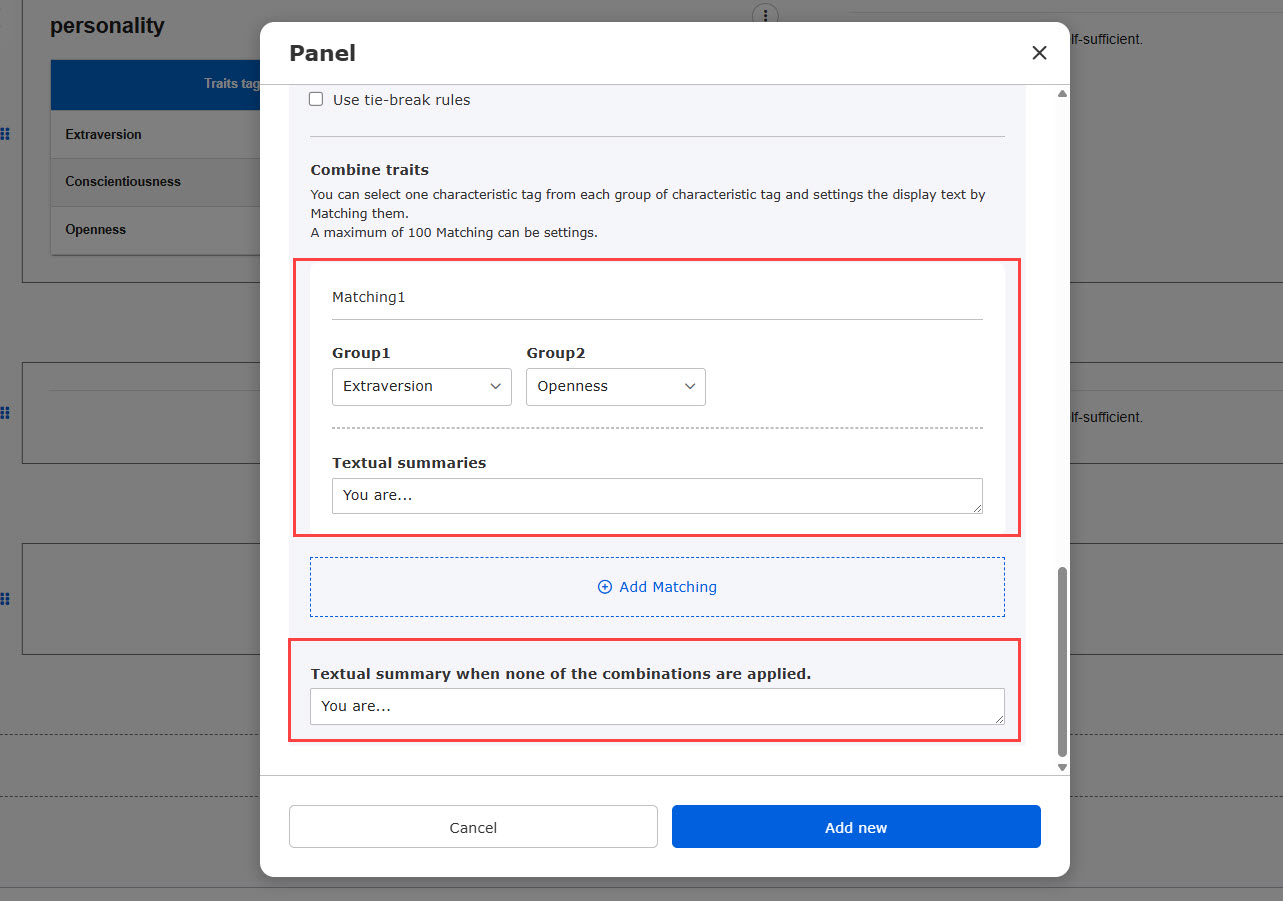
▼ Characteristic Tag Combinations
According to the combined results of multiple traits tags, different description can be displayed.
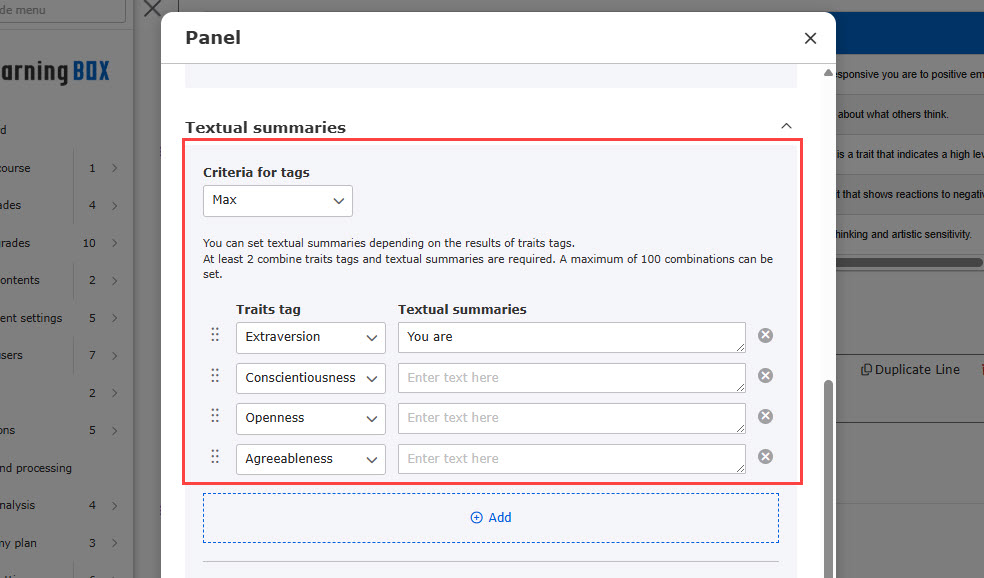
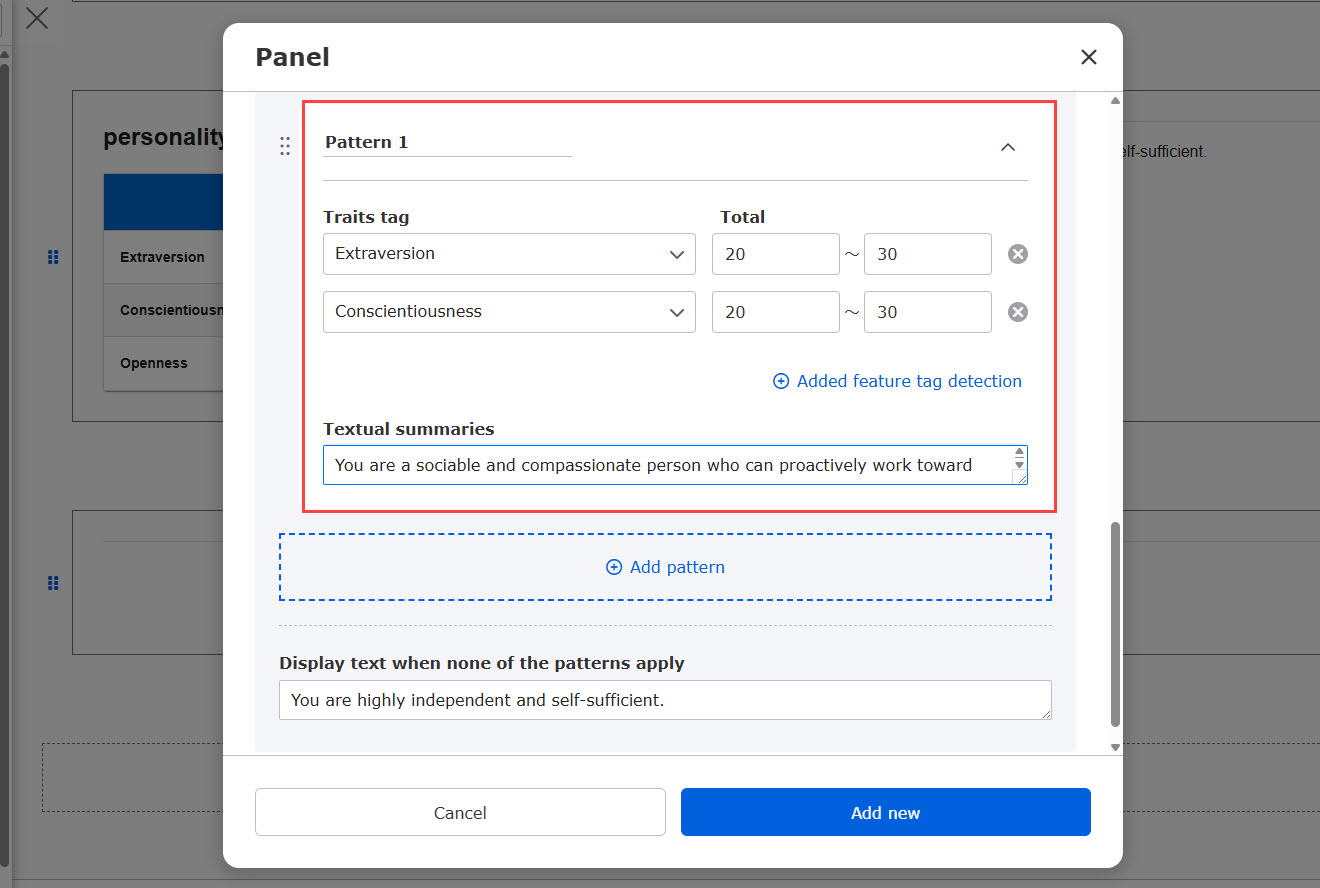
▼ Results of Multiple Characteristic Tag Determination
Multiple tags can be rated and comments can be displayed according to their total value.
*If a user's response result fits more than one pattern, the pattern at the top of the list is given priority.
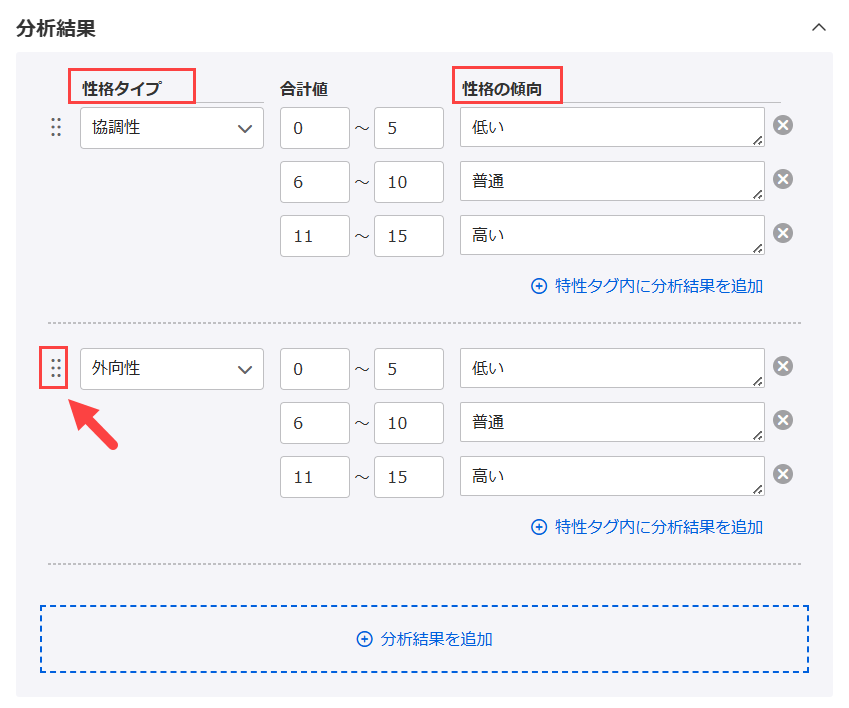
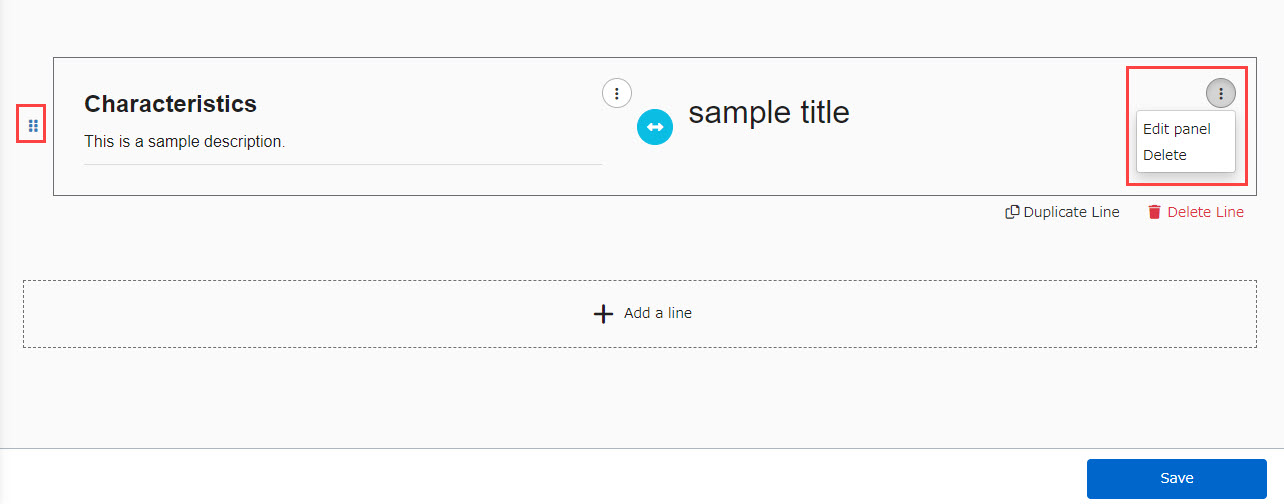
Panel Editing
Panels are edited from the three-point reader on the right side of the screen.
To rearrange the order of the panels you have created, click on the 6-point leader on the left and drag and drop it.
When a personality test is created from a template
This section explains the score chart when you create a personality test from a template.
When you select a template to create a personality test, a score chart will be also automatically created.
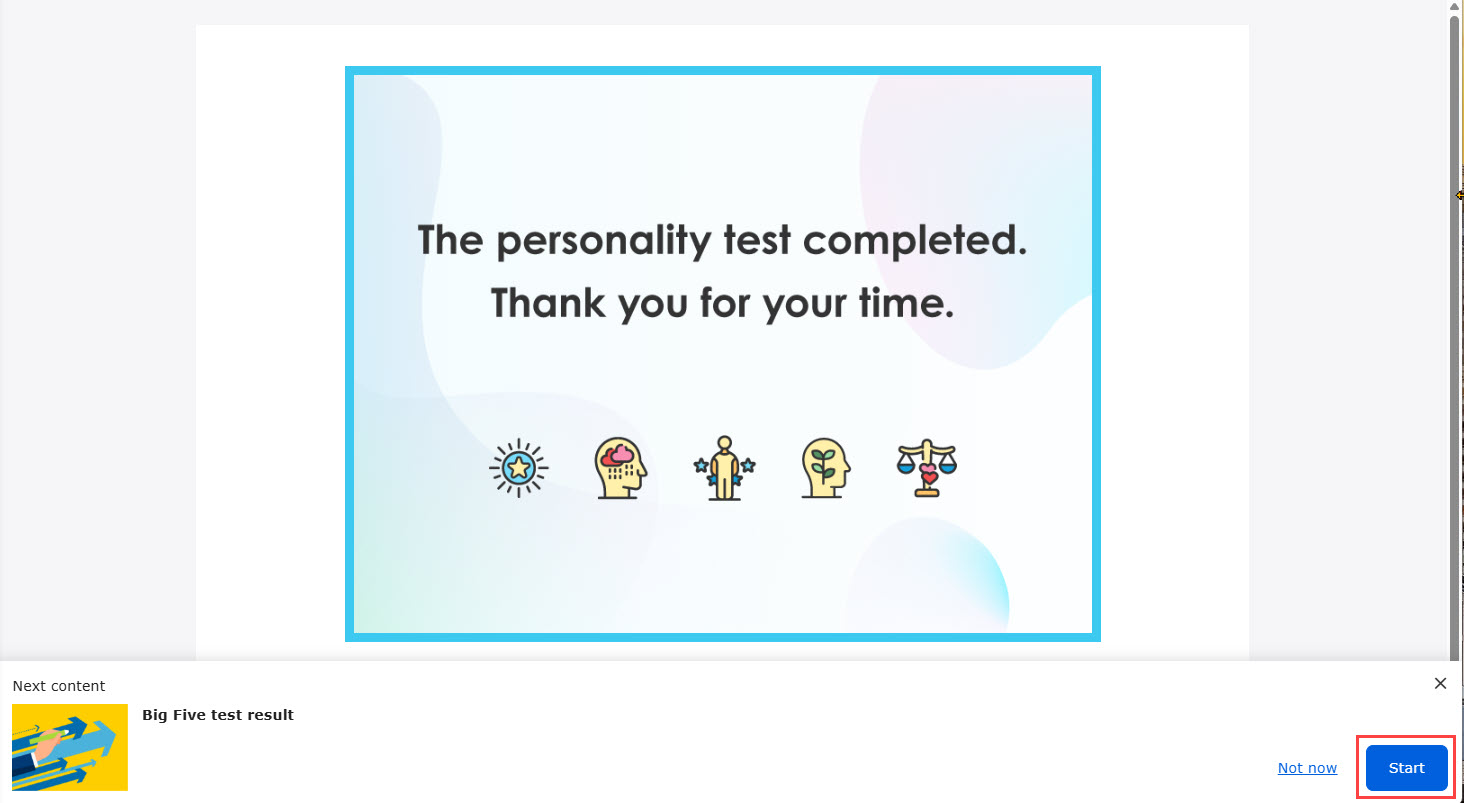
When the personality test is completed, a pop-up will appear at the bottom of the page.
Click on "Go to the results" to review the results.
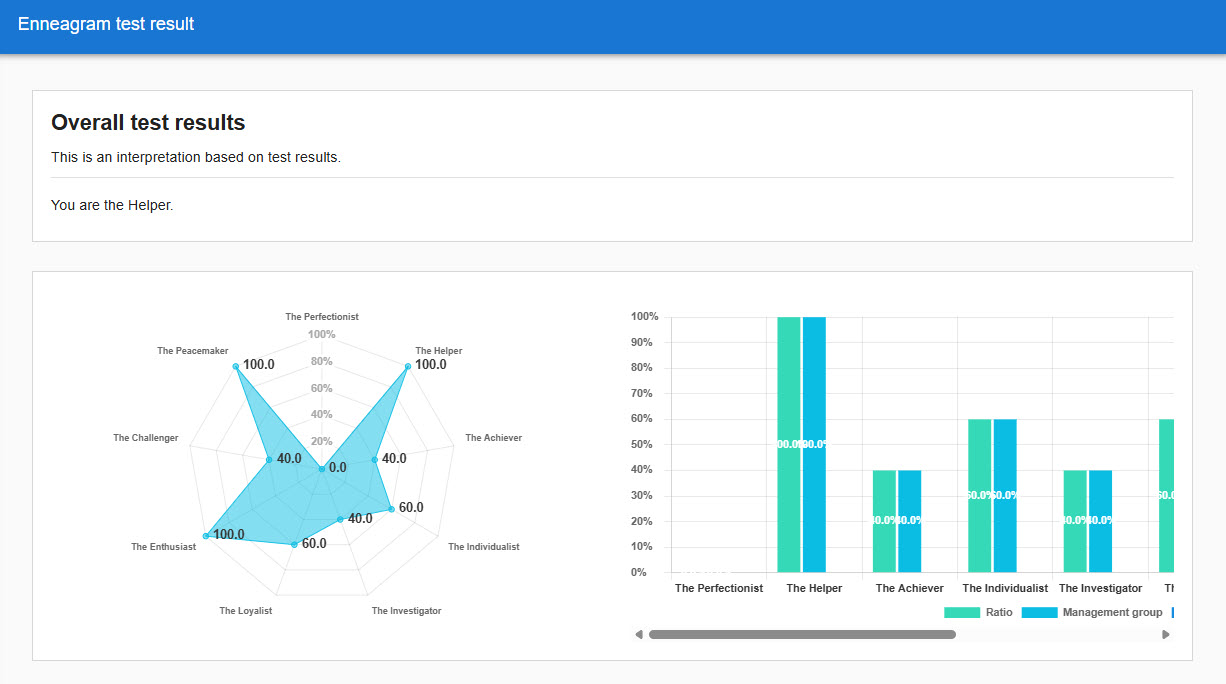
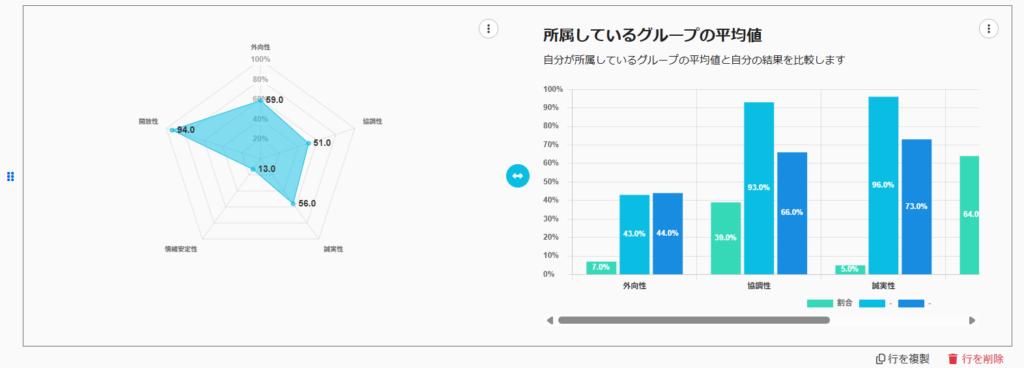
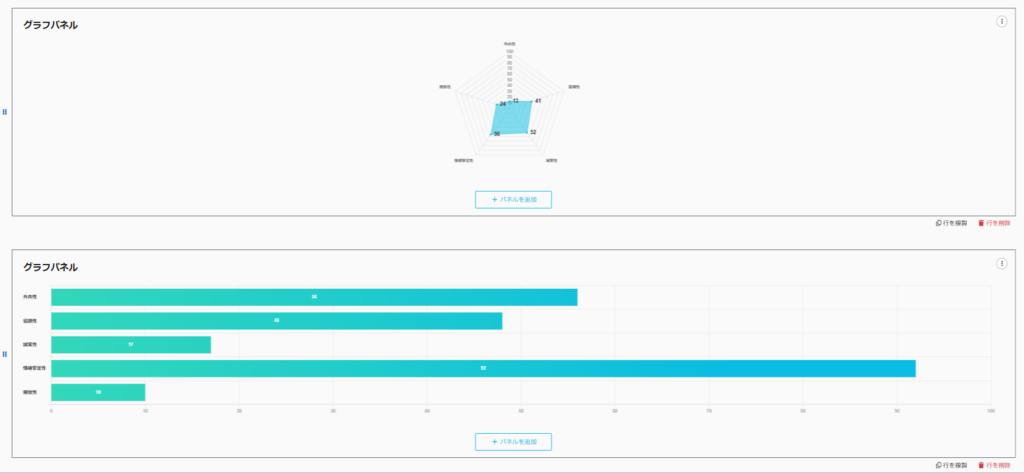
The score chart will be displayed as shown below.
The following image shows all four panels.
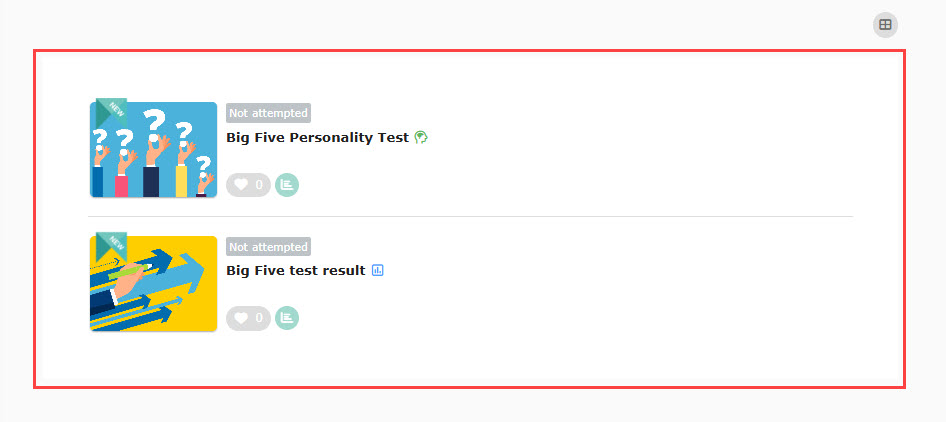
Big Five Personality Test
The Eniagram Test