Score chart (link to personality test)
By linking the results of a personality test with a score chart, the outcomes can be visualized as numerical values and graphs.
This allows you to evaluate and analyze the aptitudes and tendencies of each individual based on their unique characteristics and strengths, deepening understanding.
The following explain how to customize a score chart to visualize the results.
Create from Scratch
Create a personality test first.
After creating a test, follow the steps below.
Link to a personality test
01. Create a course
First, create a course in the Manage contents.
*For details on creating a course, refer to Course/Folder.
02. Create a score chart
Click on the course you created.
In the upper left corner of the page, select "+ Create new" > "Score chart."
03. Basic information settings
The following page will appear.
Enter a title, and select the personality test you created.
Click on "Apply."
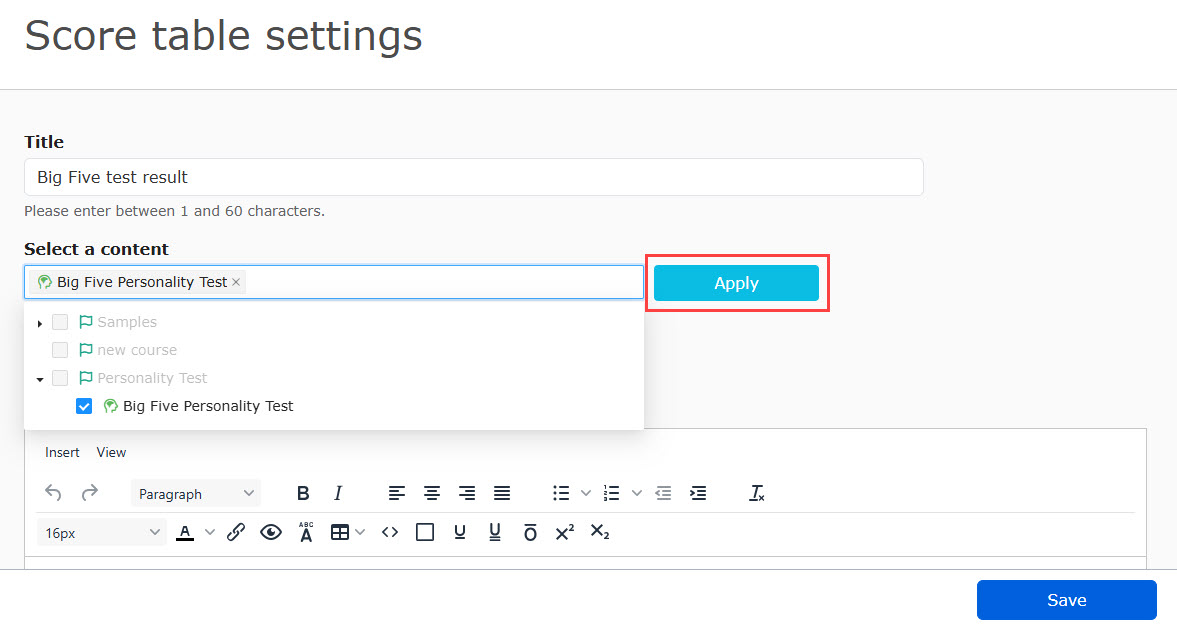
The following items will appear:
- Required number of responses
Set the number of responses to display the results.
*If the number of responses is less than the set number, the results will not be displayed in the score chart. - Help
A help page can be added.
An (?) icon will be added to the user interface.
When users click on the icon, the created page will be displayed. - Additional CSS
You can add CSS to the help page.
Add panel
Panels visualize personality data through text and charts in a consolidated view.
To create one, click "Add line" followed by "Add panel."

Up to two panels can be registered in a row.
The types of panels that can be set are as follows
- Heading panel
- Table panel
- Graph panel
- Summary panel
Heading panel
You can add a heading in the score chart.

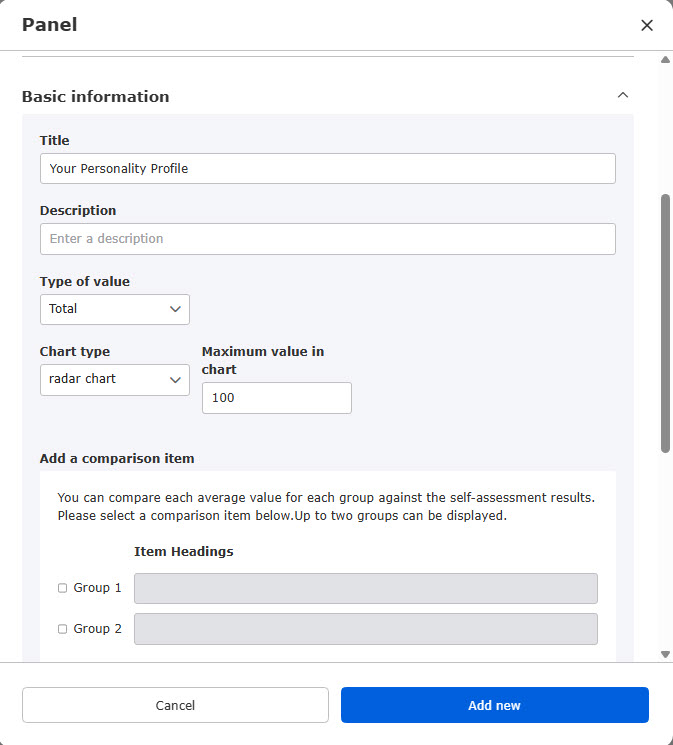
Basic information
Set the details in the Basic information in each panel.
Enter text and set the font size.

If you tick the "Set ID on panel," an ID will be assigned automatically. By using this ID, it will be easier to identify data when acquiring response data through API.
To use the API integration, Customization option is required.
Table panel
Learner responses can be classified and aggregated by trait tag.
The aggregated data can also be used to display different analysis results based on the total value.
Personality test results are analyzed using the trait tags configured for each question.
*Trait tags are labels used in personality test questions.
The following panel types can be configured:
- Personality test results
- Trait tag analysis results
▼Personality test results
Results from a personality test are aggregated by trait tag and displayed in a table.
The content linked via basic information and trait tags are reflected as shown below.
*If no item name has been entered, the trait tag name will be displayed.

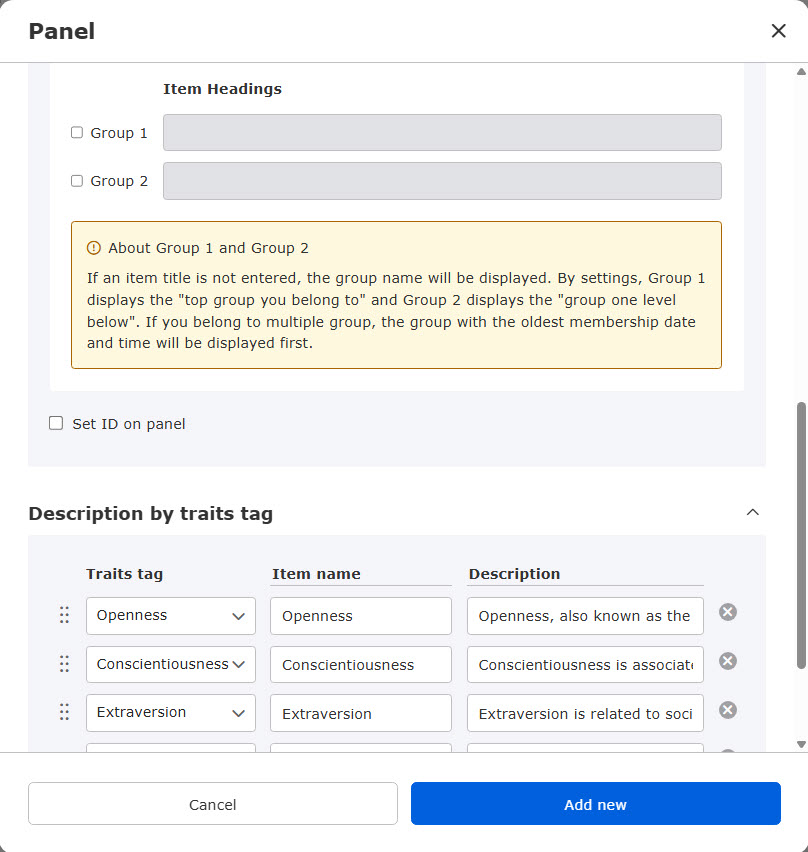
Basic information
The average value for Third-party evaluation and each group can be compared against the test results.
*One third-party evaluation and up to two groups can be displayed.
▼ Trait tag analysis results
Personality test results can be displayed in a table organized by trait tag.

Basic information
Analysis results can be changed based on the total value of the trait tags.
Evaluation can be performed using multiple trait tags, and comments can be displayed according to the Total value, Personal average, Standard deviation, or Percentage (%) selected in the Value type drop-down menu.

Item names and display order are editable.

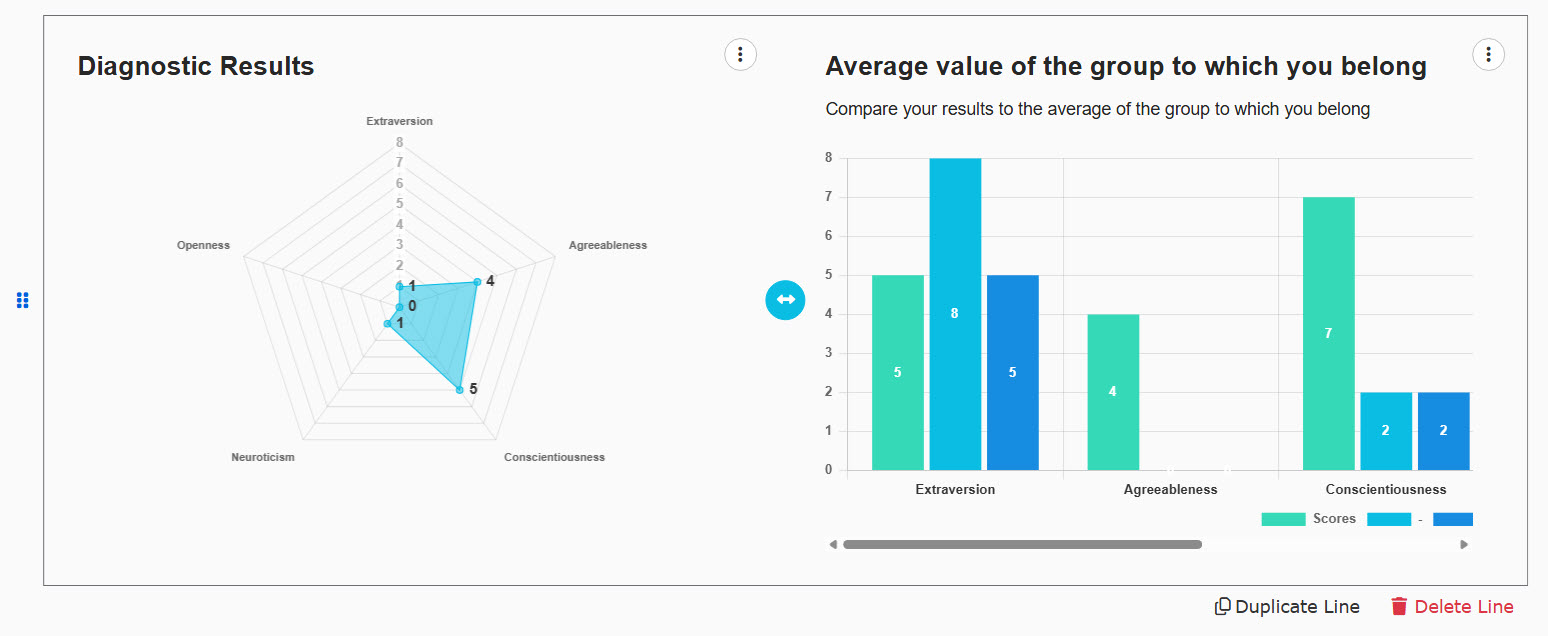
Graph panel
Personality test results are aggregated by trait tag and displayed as a graph.
The graph can be displayed in one of two formats: radar chart or bar chart.
*If no item name has been entered, the trait tag name will be displayed.

Basic information
The average value for Third-party evaluation and each group can be compared against the test results.
*One third-party evaluation and up to two groups can be displayed.
Summary panel
Personality test results are displayed as text organized by trait tag.
The content displayed can also be changed based on the total value of each trait tag.
*The maximum number of characters that can be displayed is 3,000.
The following panel types can be configured:
- Trait tag analysis results
- Minimum/maximum value of characteristic tag
- Combination of characteristic tags
- Result of multiple characteristic tags
▼ Trait tag analysis results
Personality test results are displayed as text for each trait tag, and the content can be changed based on the total value of each trait tag.
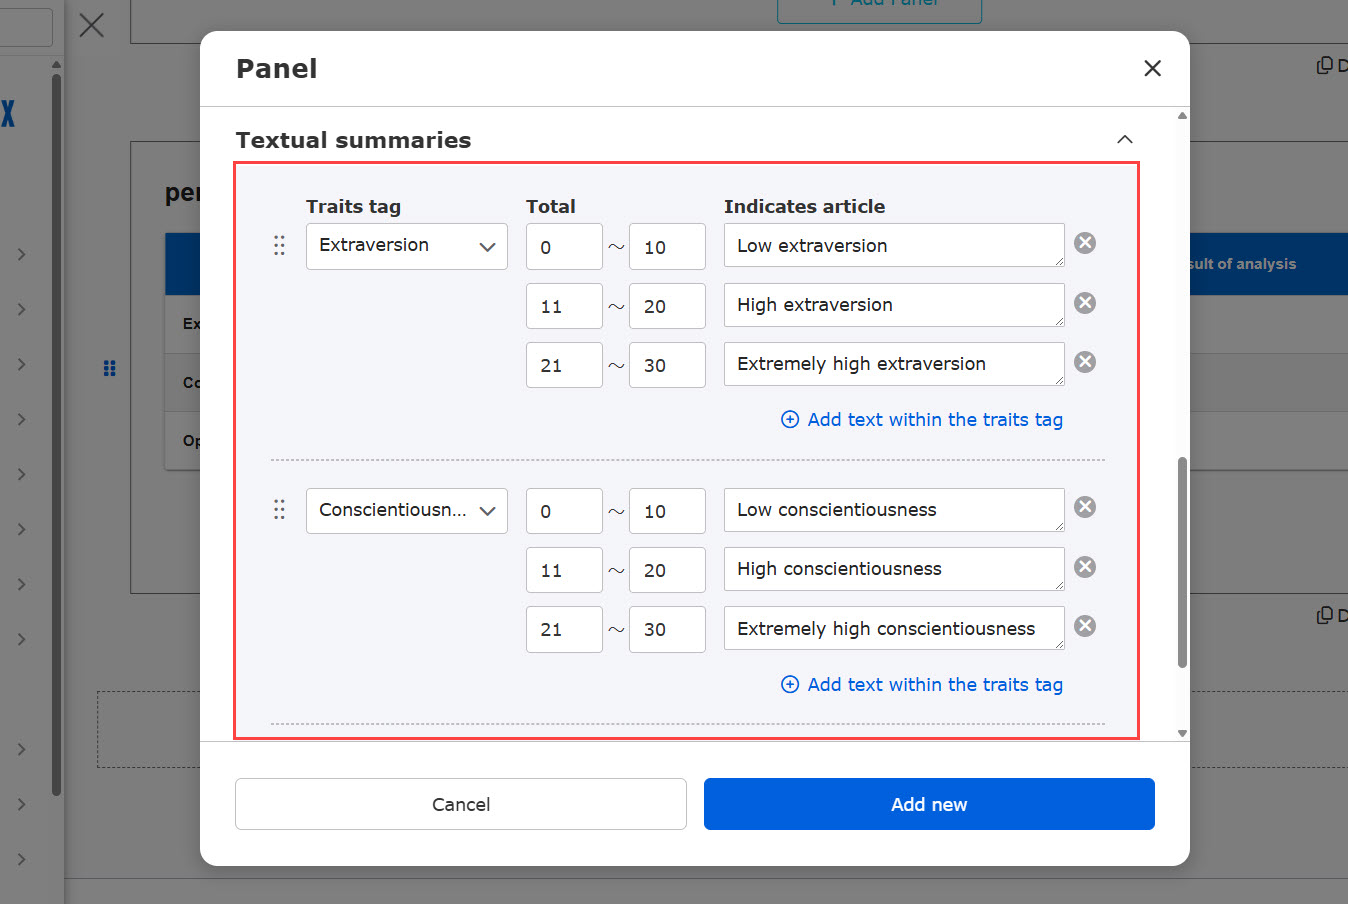
▼Trait tag minimum/ /Maximum value
Multiple trait tags can be configured, and different text can be displayed based on the result range (minimum to maximum value).
The maximum number of trait tags that can be configured is 100.
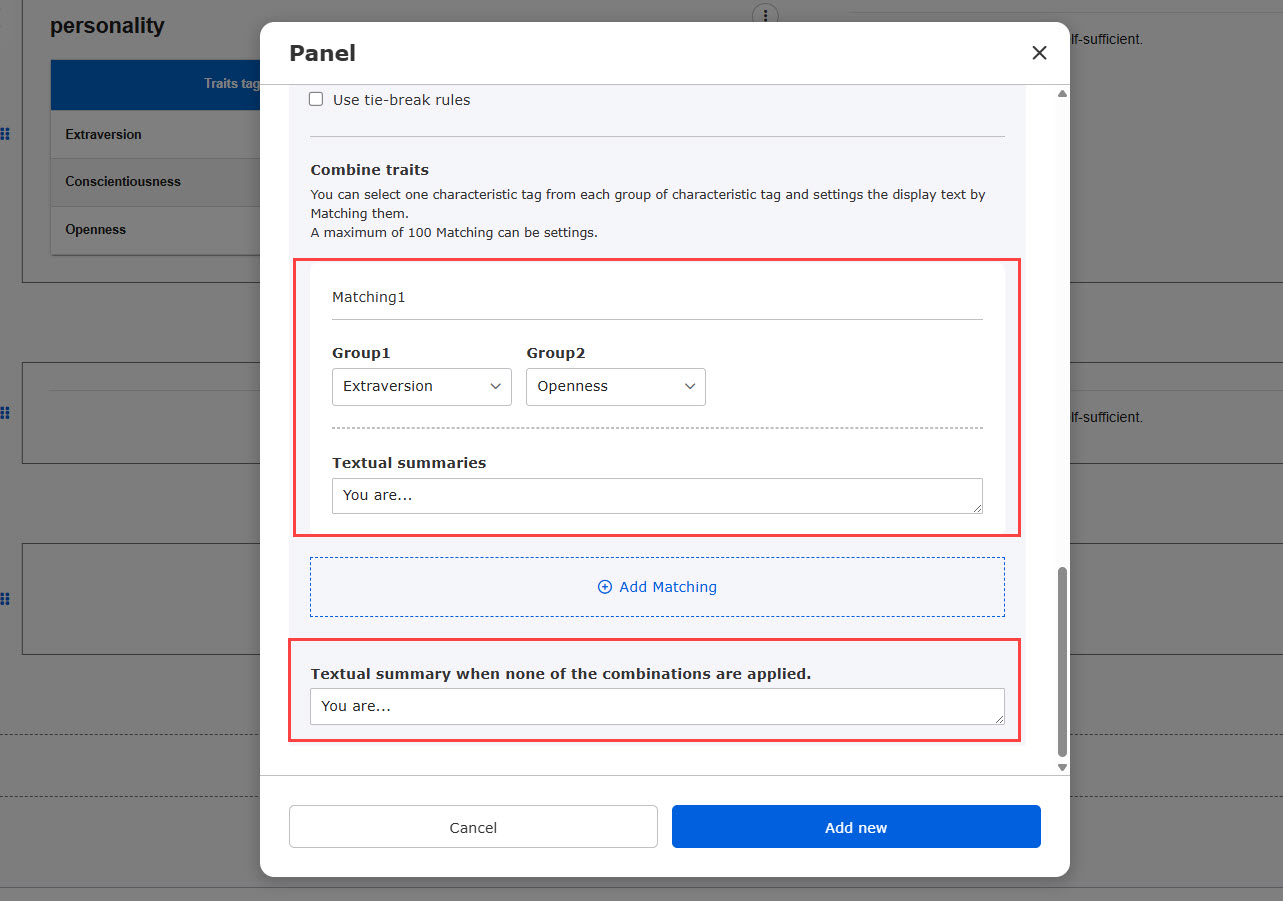
▼ Combine traits
Multiple trait tags can be combined, and different text can be displayed based on the combination result.
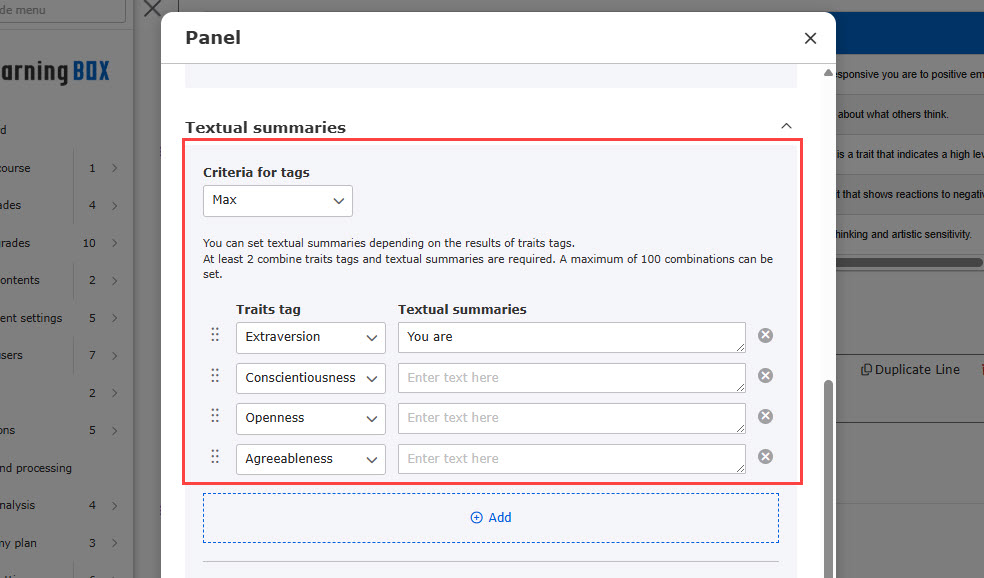
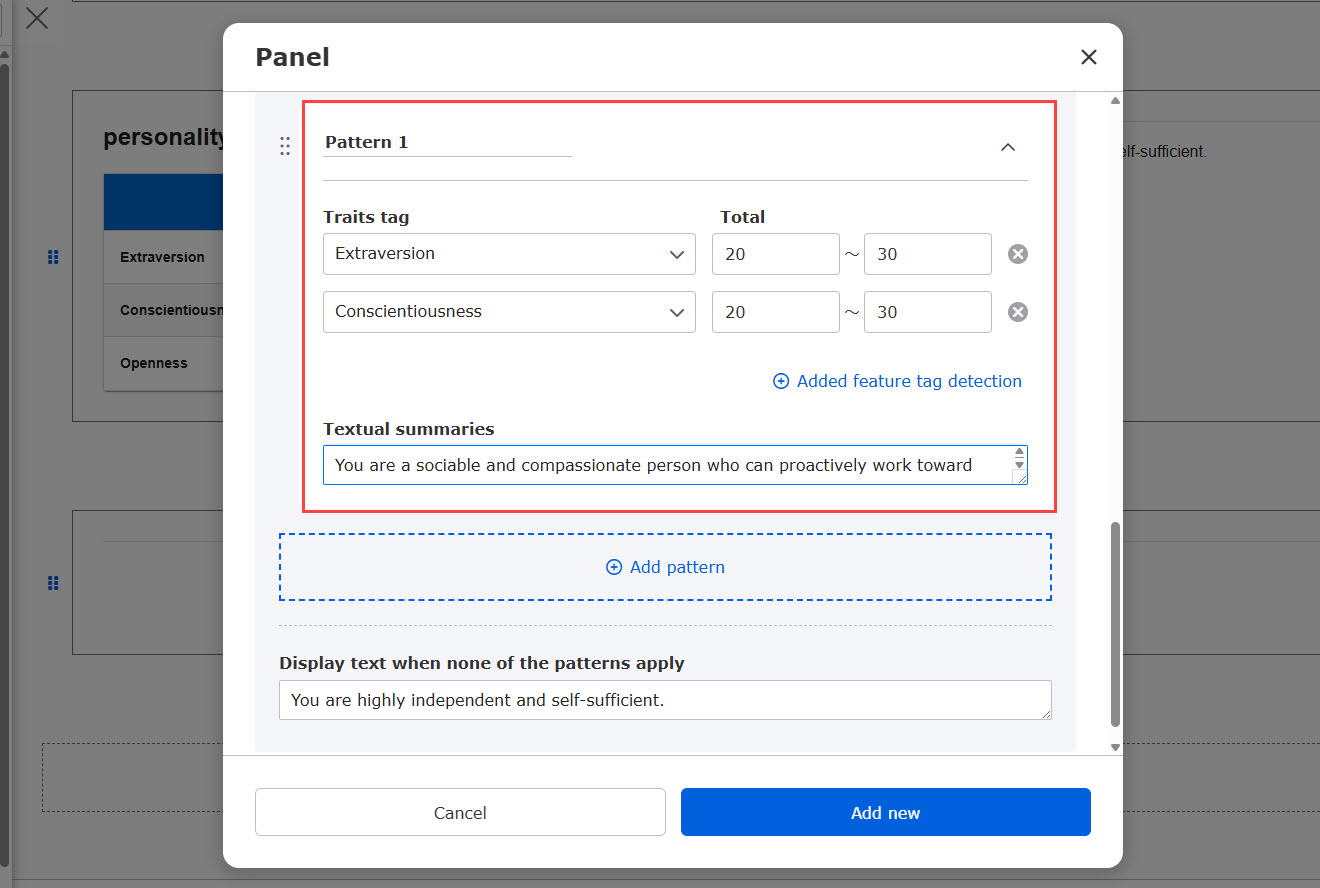
▼ Multi-trait tag evaluation results
Evaluation can be performed using multiple tags, and comments can be displayed based on their combined total values.
*If a learner's response matches multiple patterns, the pattern positioned highest in the list will take priority.
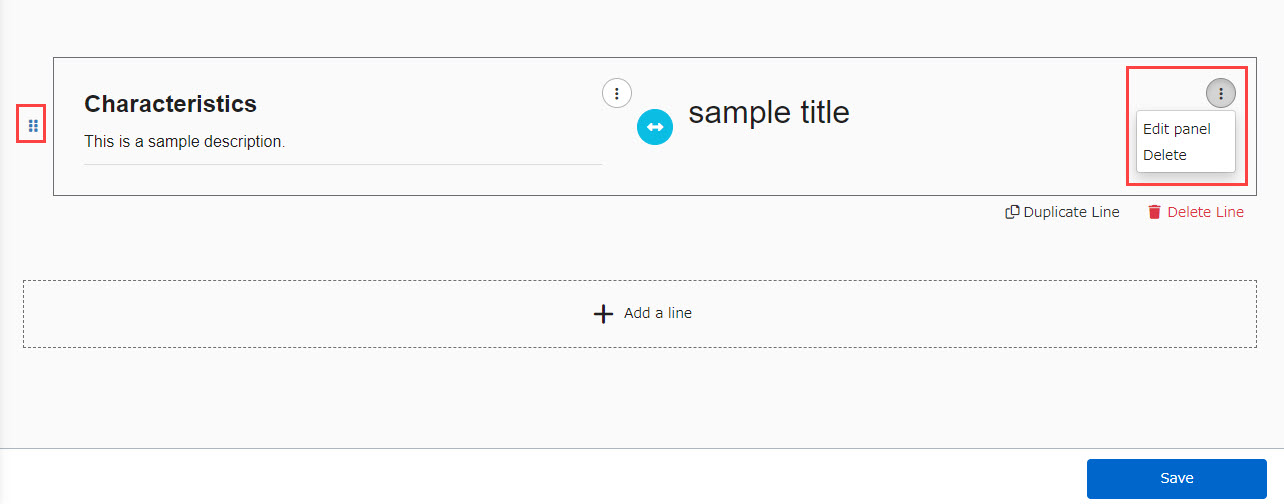
Edit panel
To edit panels, click the "︙" icon.
To reorder the panels you've created, drag and drop the panel using the "⋮⋮" icon.
Create from a template
This section explains the score chart when you create a personality test from a template.
When you select a template to create a personality test, a score chart will be also automatically created.

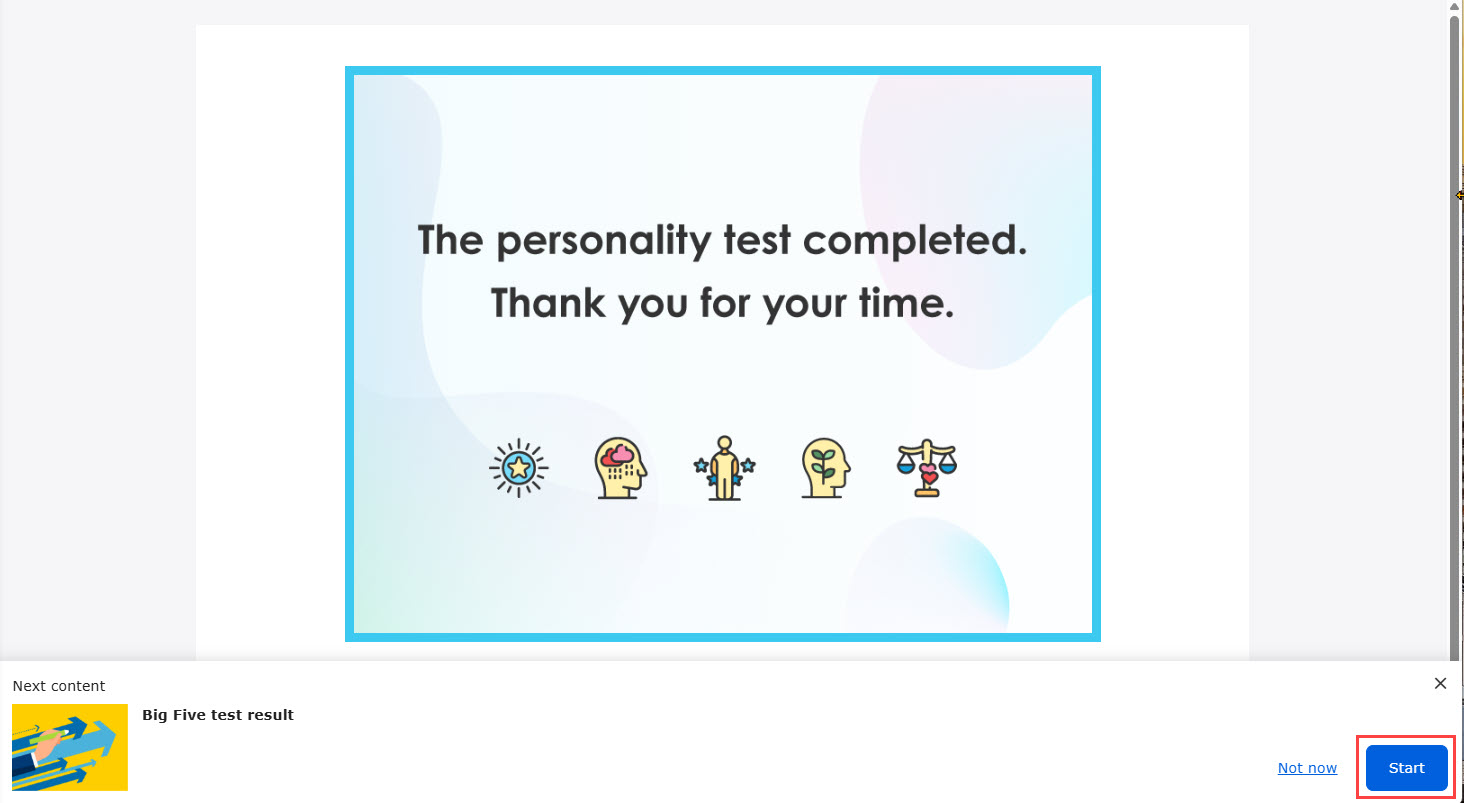
When the personality test is completed, a pop-up will appear at the bottom of the page.
Click on "Go to the results" to review the results.
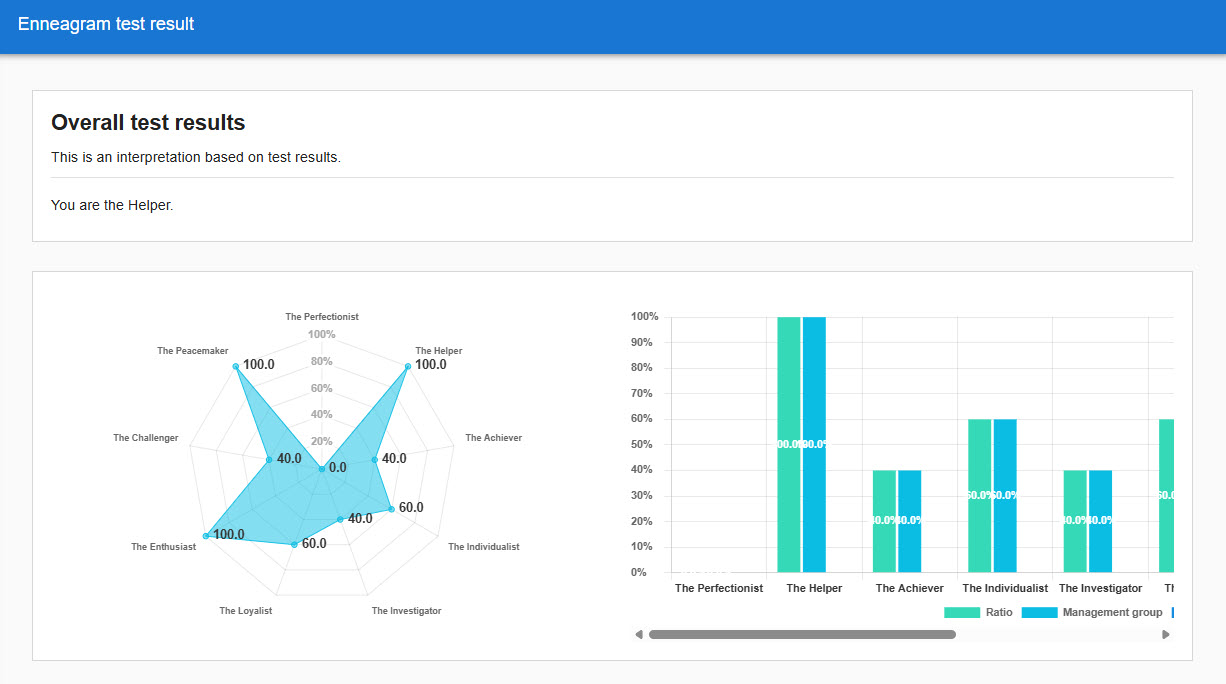
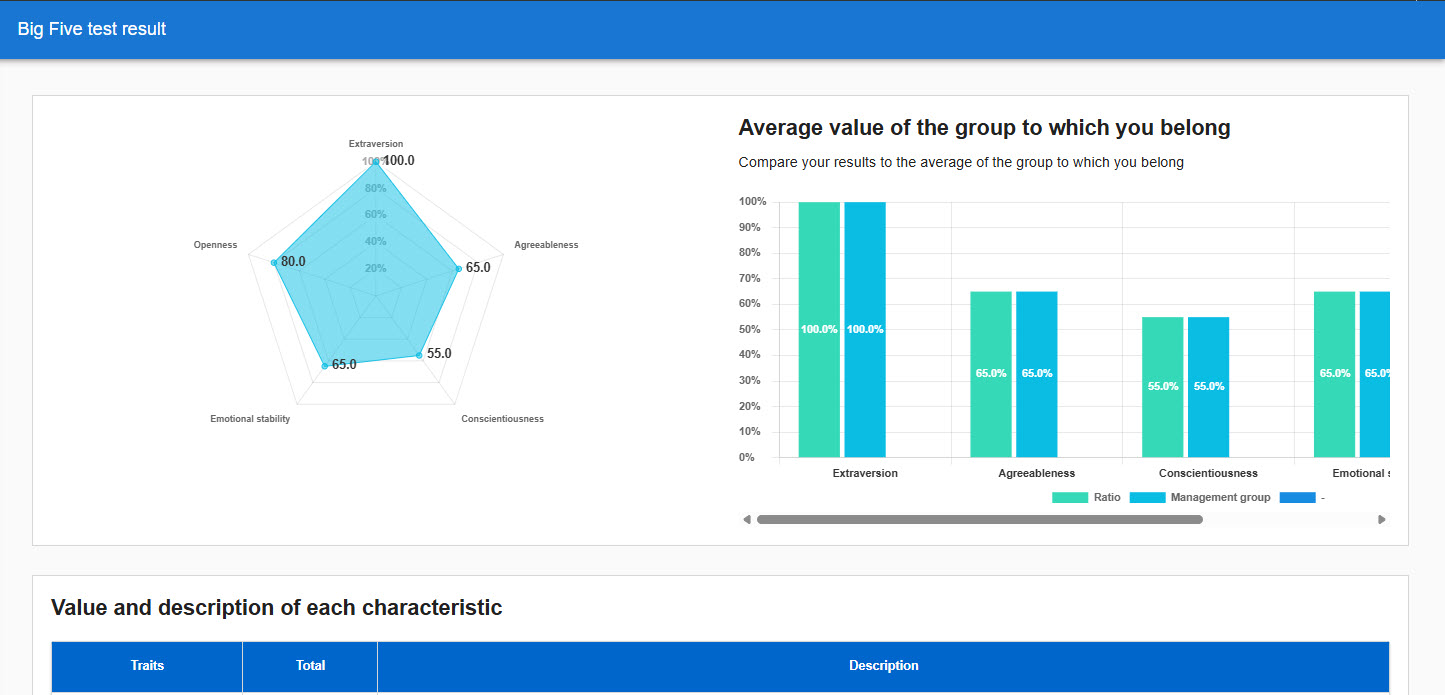
The score chart will be displayed as shown below.
The following image shows all four panels.
Big Five Personality Test
The Enneagram test