Score chart
The results of the personality test can be linked to Score board.
This section describes a score chart.
Create a score chart
The following explain a score chart created without a template.
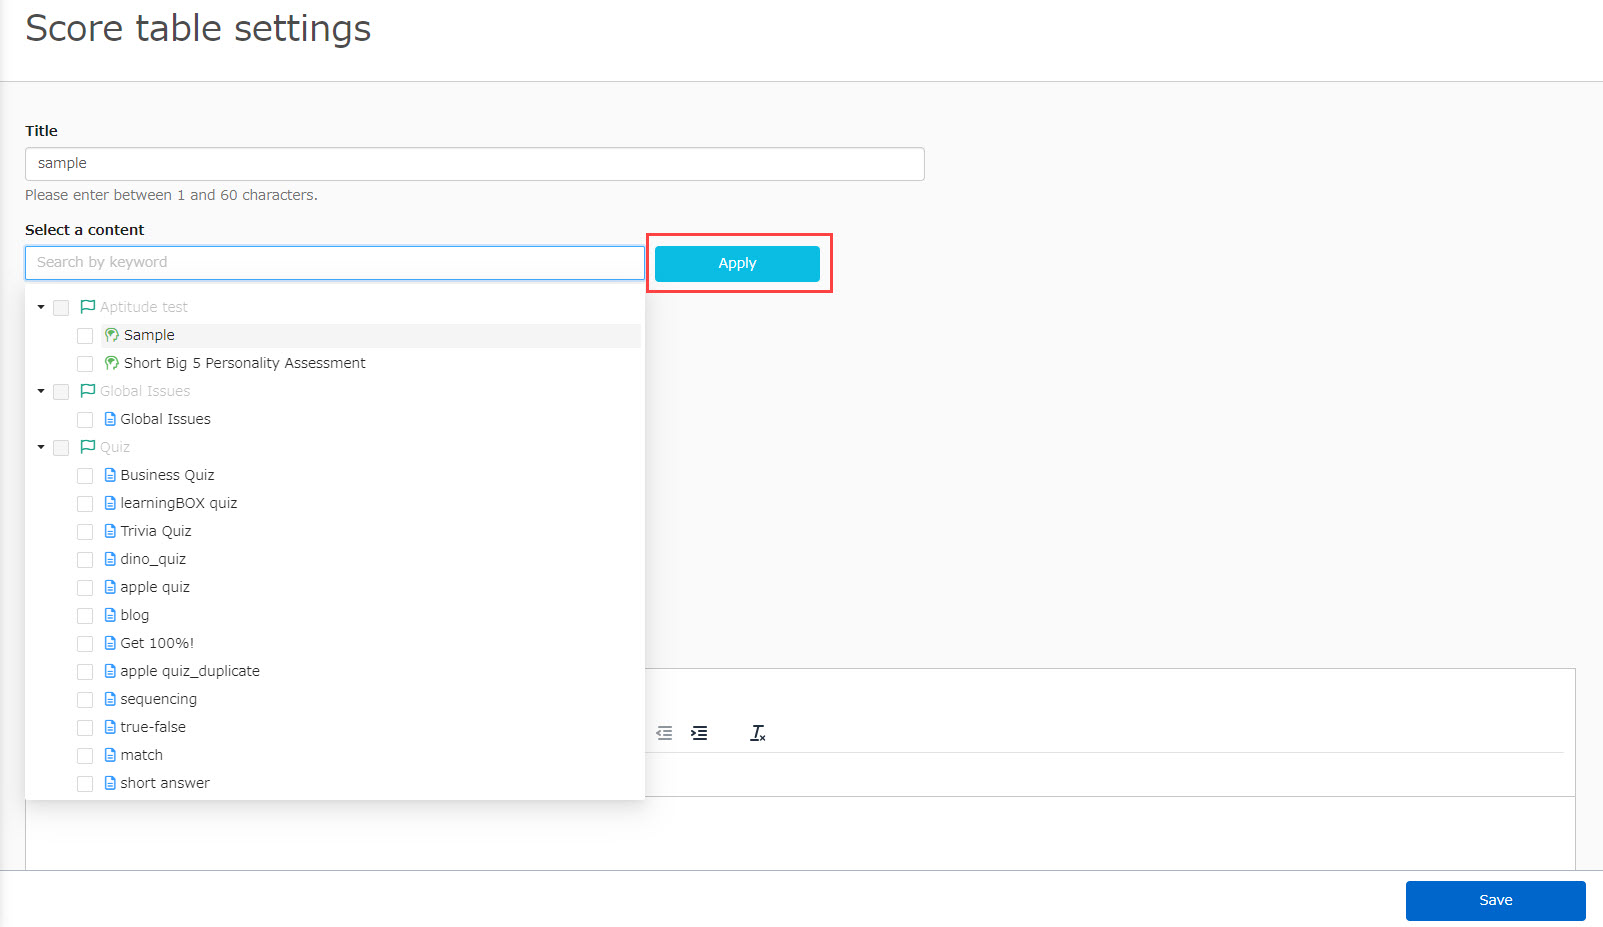
01. Select Personality test
On the Manage content, select a course you created and click "+" icon > Score chart
Enter a title and select a personality test you created.
02. Add a panel
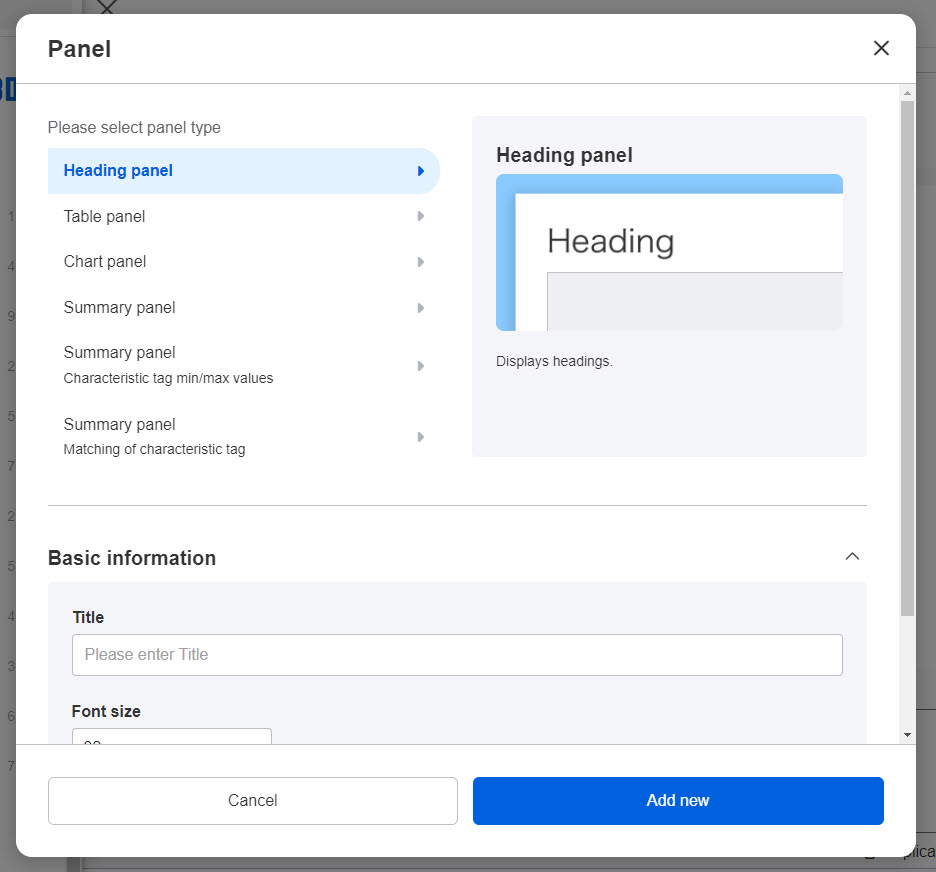
Click on "Add a line" > "+ Add Panel" at the bottom of the page > Select a panel type.
*There are six panel types.
Common items in each panel
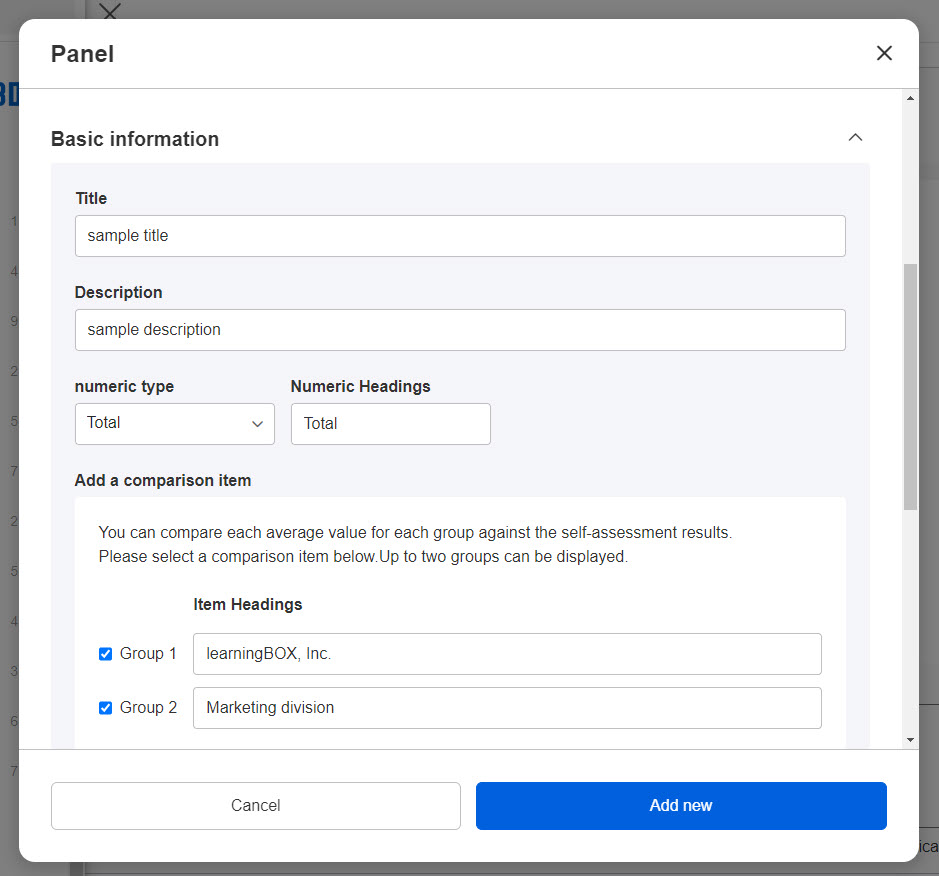
▼Basic information
Results with group averages and third-party evaluations can be compared to the self-evaluation.
Set the object to be compared.
You can set up to two groups in addition to a third-party evaluation.
▼ Traits tag
Select traits tags set in the personality test and enter the item name and description.
Heading panel
Enter the title and select the font size.
To rearrange panels, click the icons on the left and drag & drop to move them.
*You can edit panels from the three-dots icon.
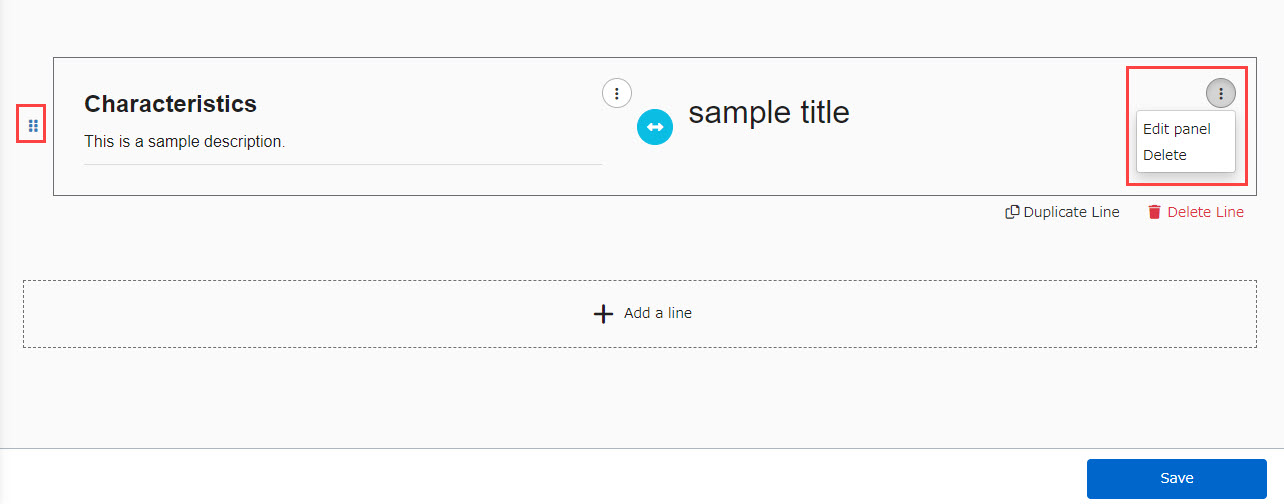
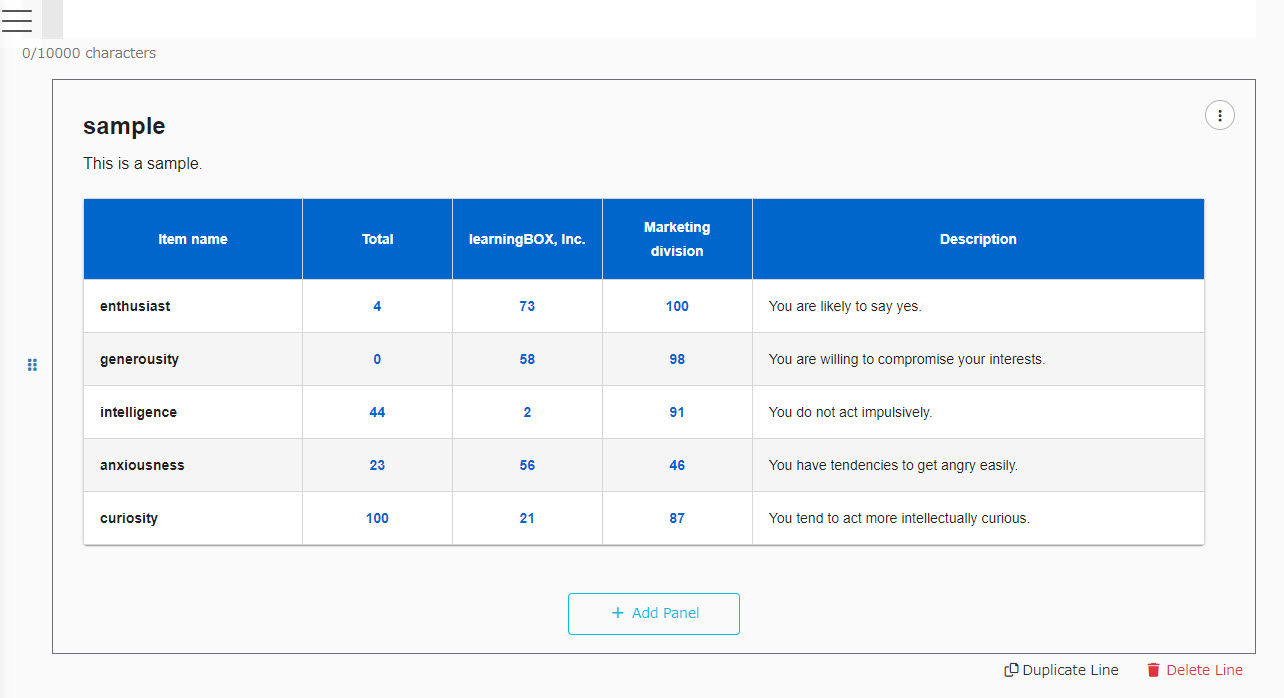
Table panel
Basic information and content linked to the traits tags will be shown as follows.
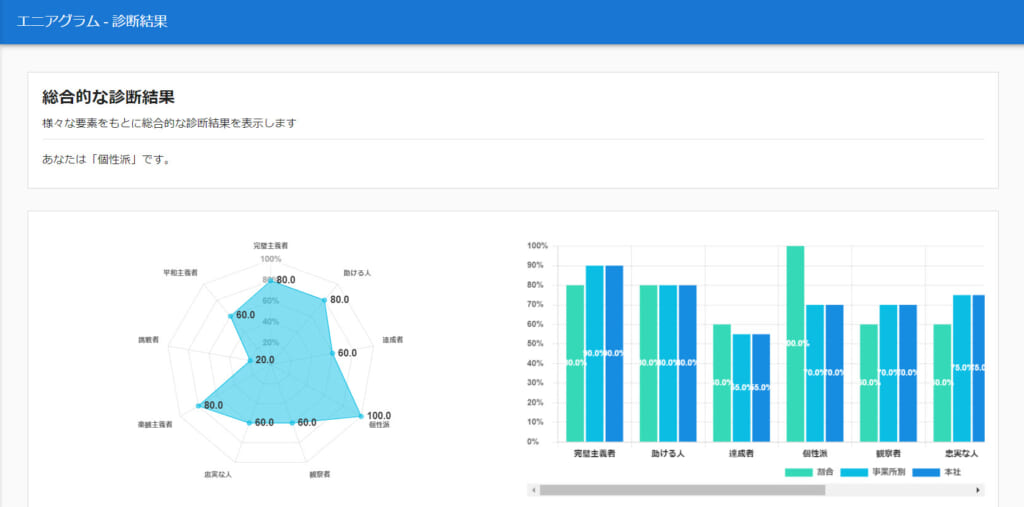
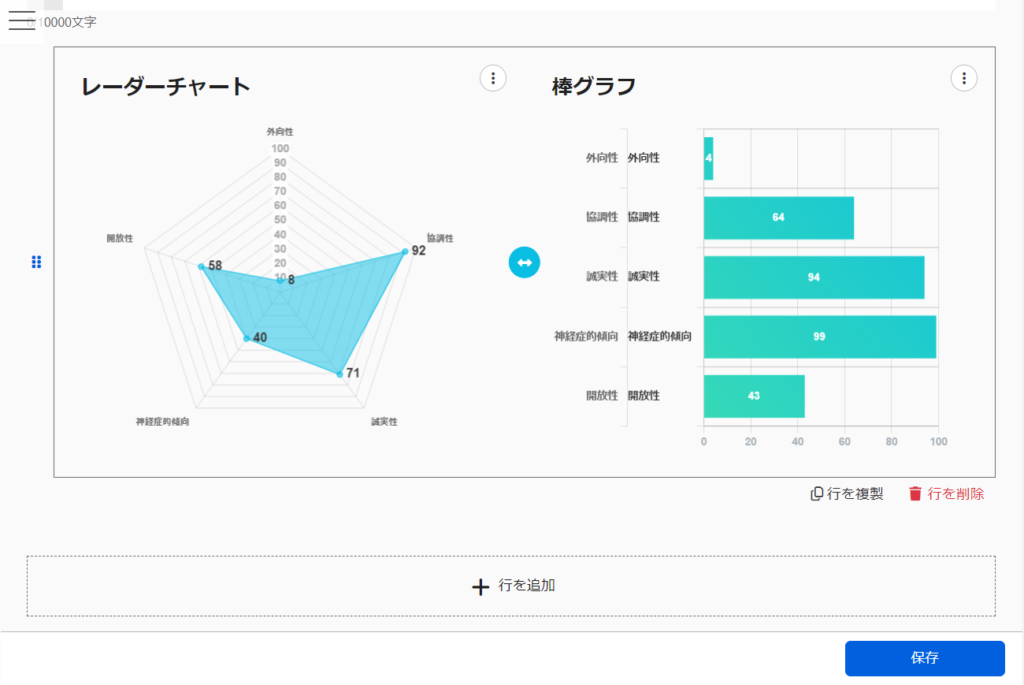
Graph panel
The graph can be selected from two patterns: a radar chart and a bar chart.
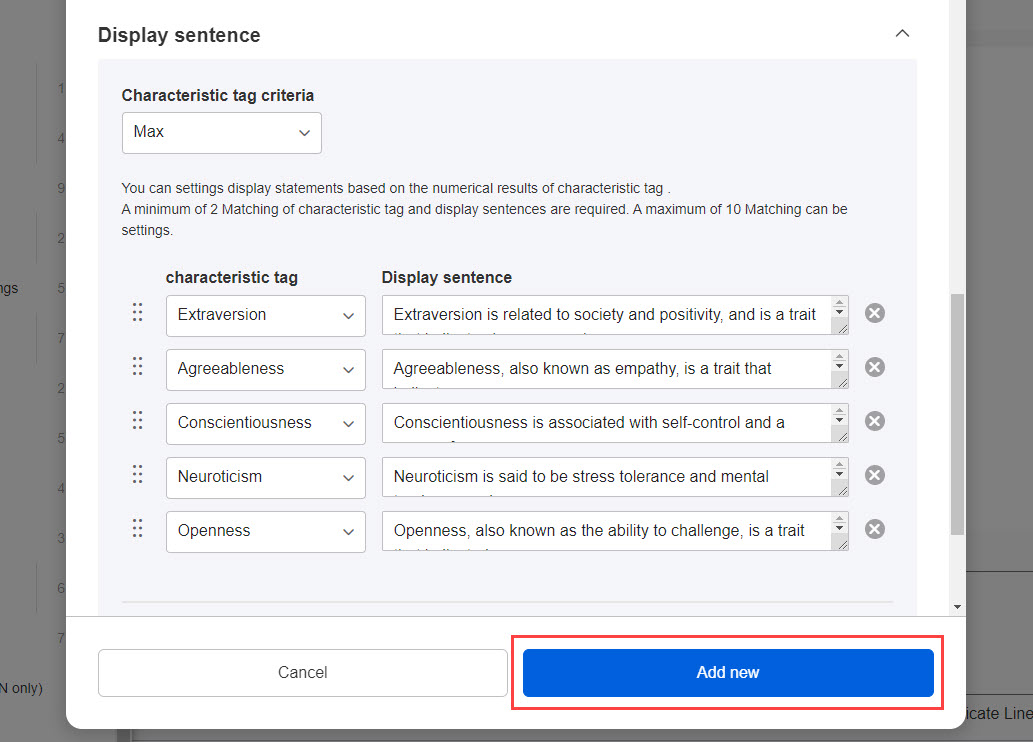
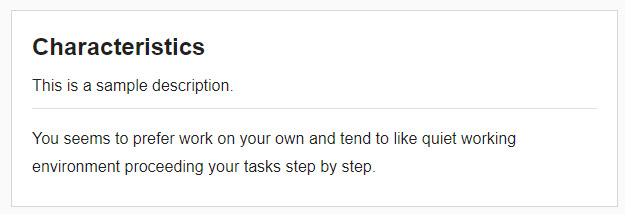
Summary panel
The results of the personality test will be shown in text for each trait tag.
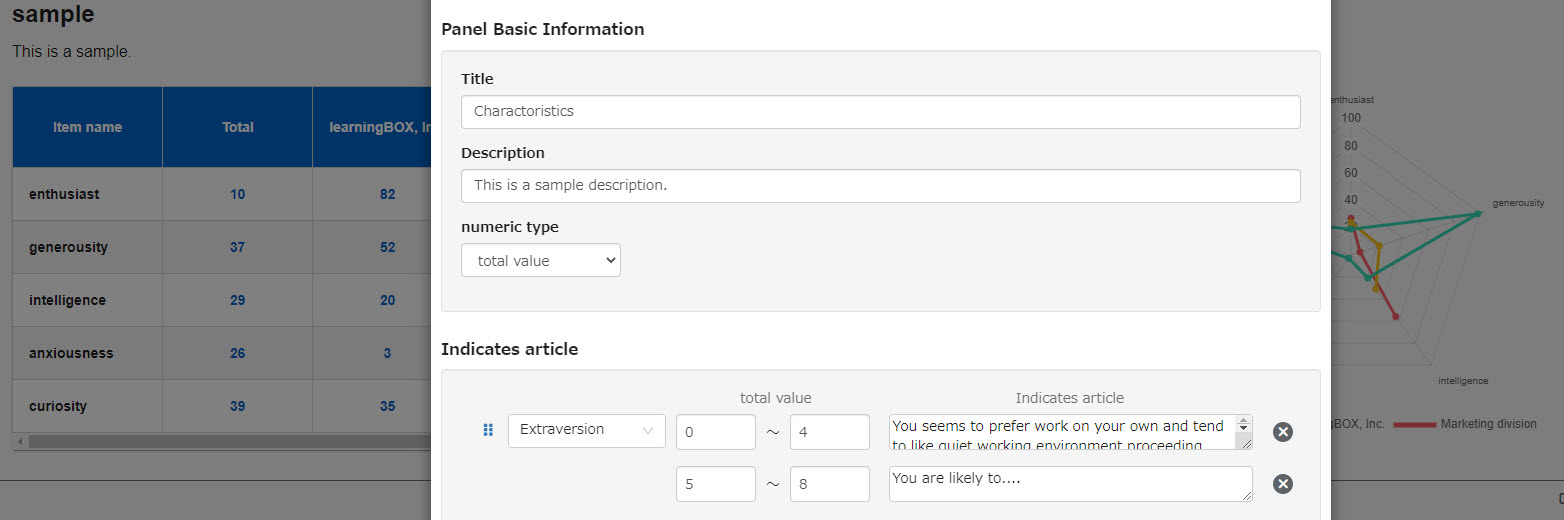
Depending on the total value of the tags, different text can be shown.
Specify sentence from multiple results
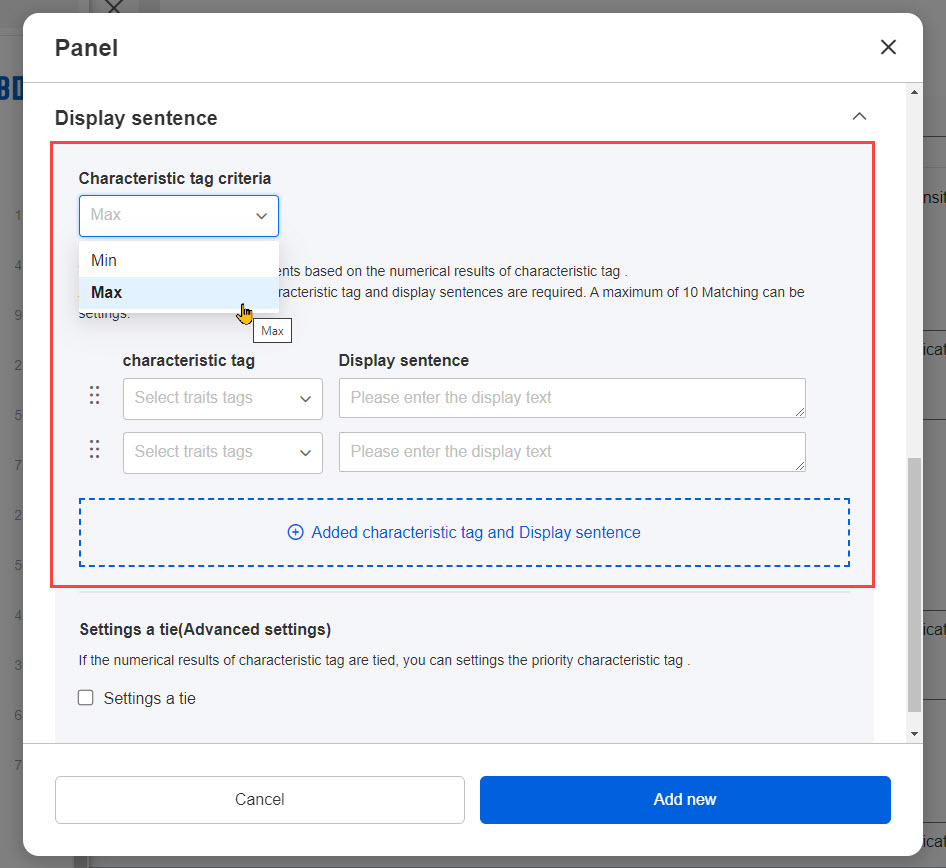
Case 1. Text panel (min/max value of traits tags)
Multiple traits tags can be set.
According to the result, different description will be displayed.
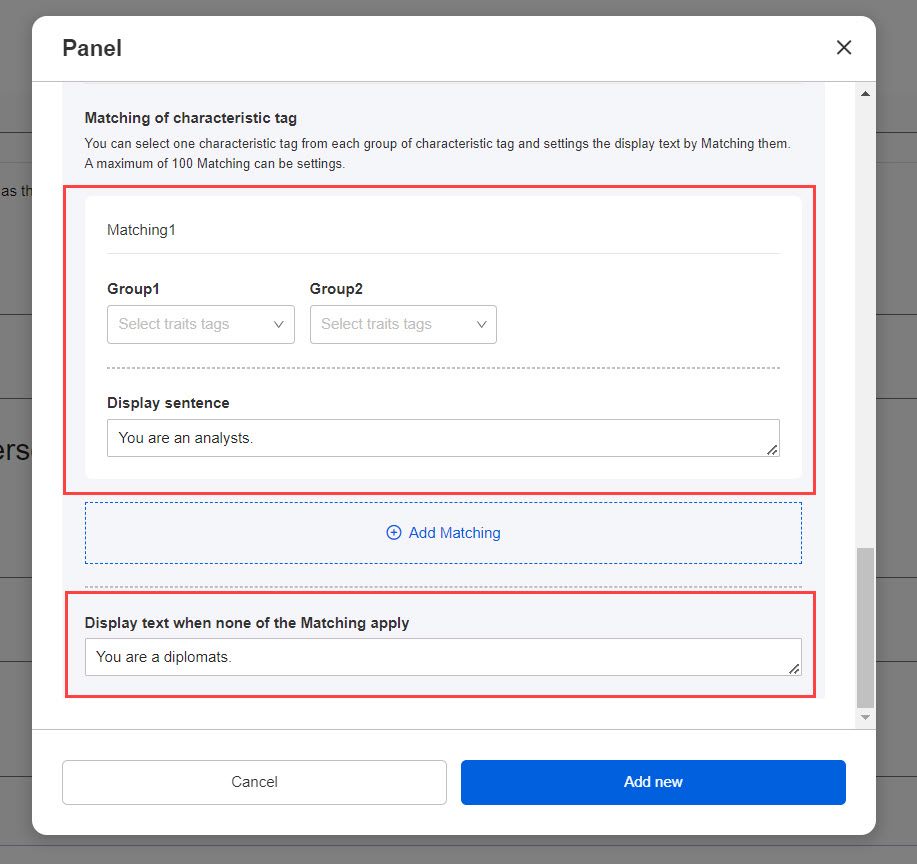
Case 2. Text panel (combination of traits tags)
According to the results of multiple traits tags, different description can be displayed.
When a personality test is created from a template
This section explains the score chart when you create a personality test from a template.
When you select a template to create a personality test, a score chart will be also automatically created.
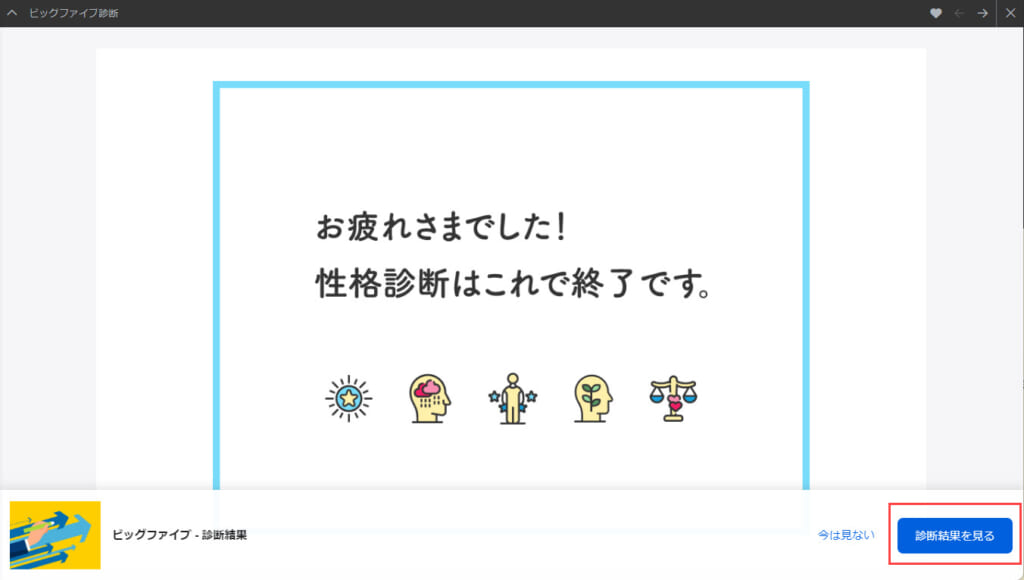
When the personality test is completed, a pop-up will appear at the bottom of the page.
Click on "Go to the results" to review the results.
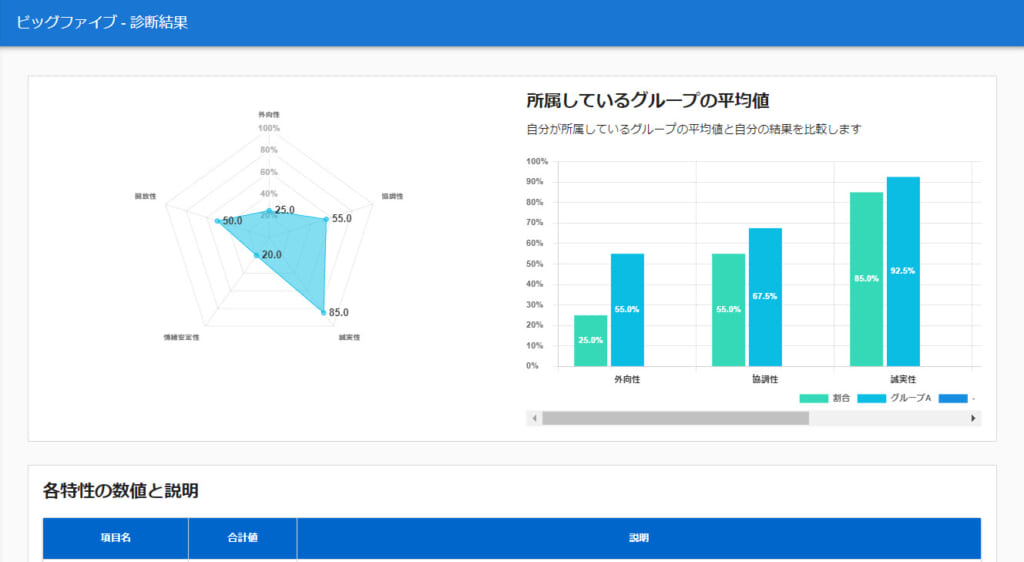
You will be redirected to the Grades screen as shown below.
This one is shown with all four panel types set.
Big Five Diagnosis
Eniagram Diagnosis