Analyze grades
Grade managers can check learners' results and answer details with tables and graphs.
Also, each score and time spent will be displayed in ranking format.
*Go to "Manage grades" > "Analyze grades" in the side menu.
Required
Management role of Grade manager
Analyze grades
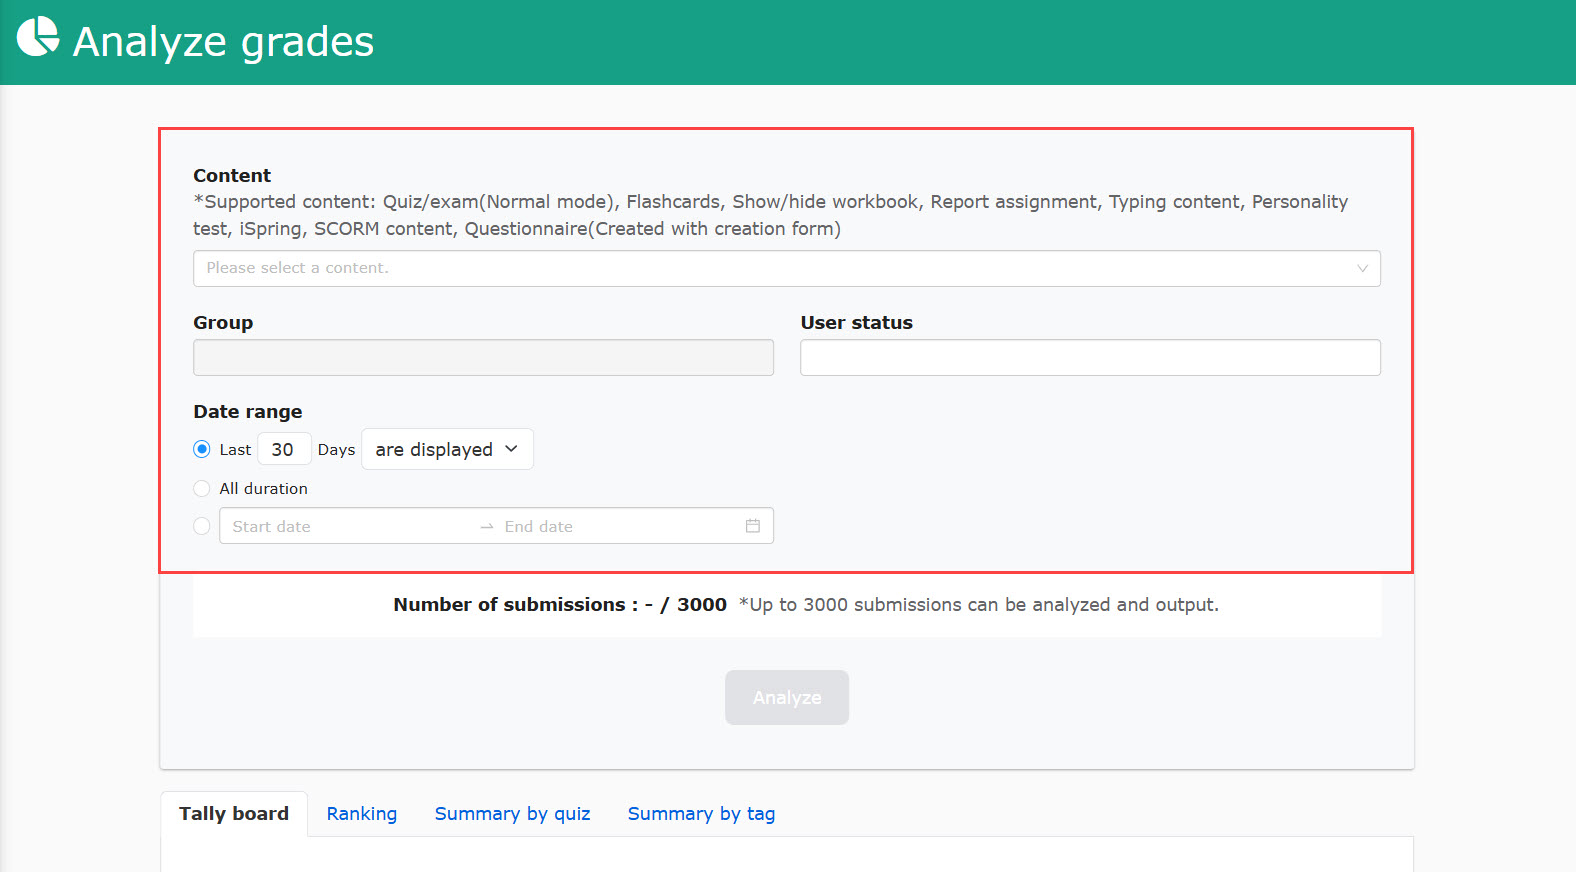
01. Select content to analyze
Filter the data in the search box on the top of the page.
Select items from each field.
Click on Analyze.
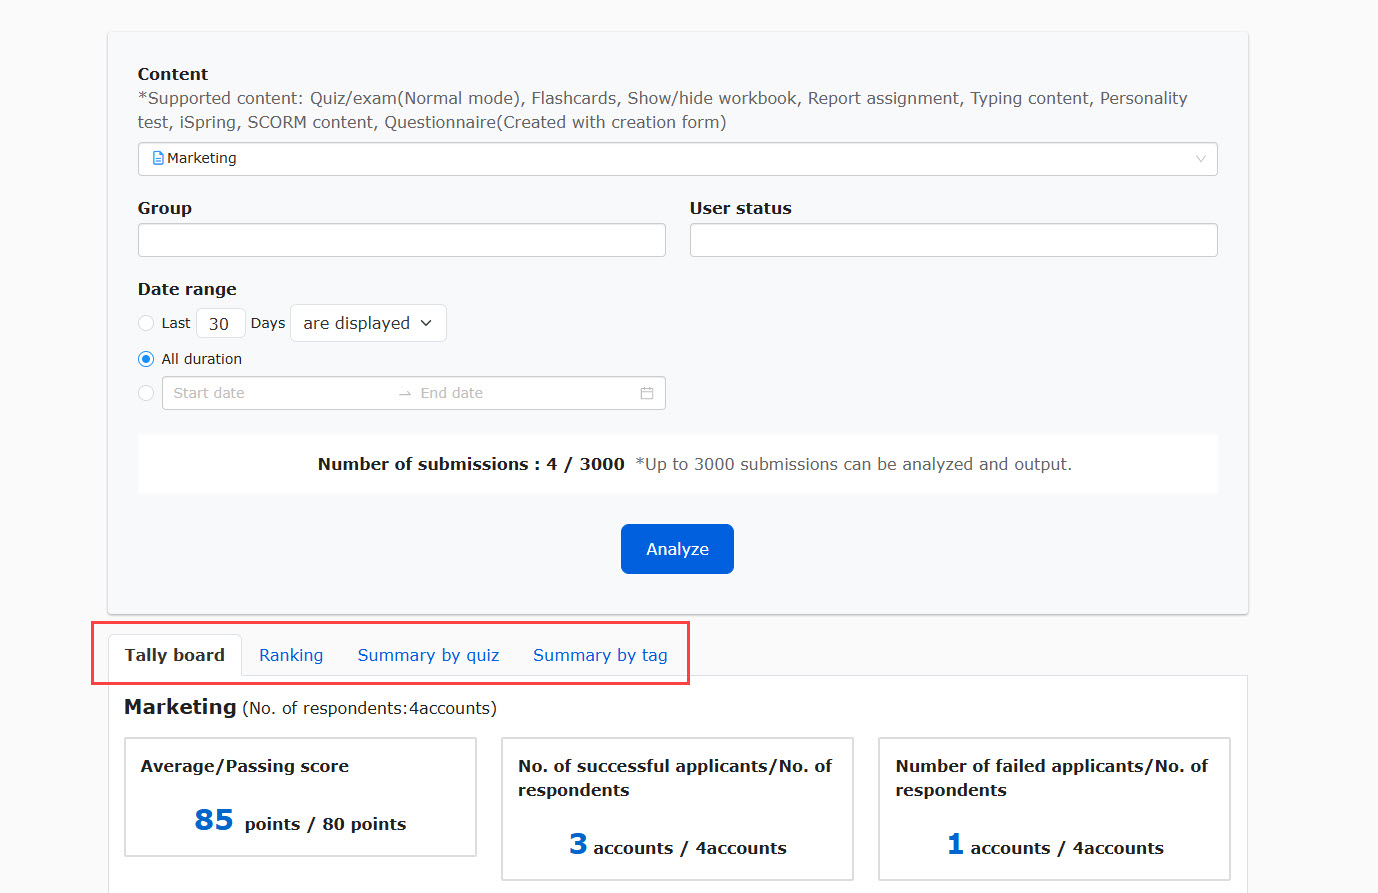
02. Select analysis method
There are four types of analysis methods in this section.
Each tab shows the detailed results.
- Tally board
- Ranking
- Summary by quiz
- Summary by tag
Some content may not be available to analyze.
Please note that not all analysis methods can be used in all content.
The following explain the details of each methods.
Analysis methods
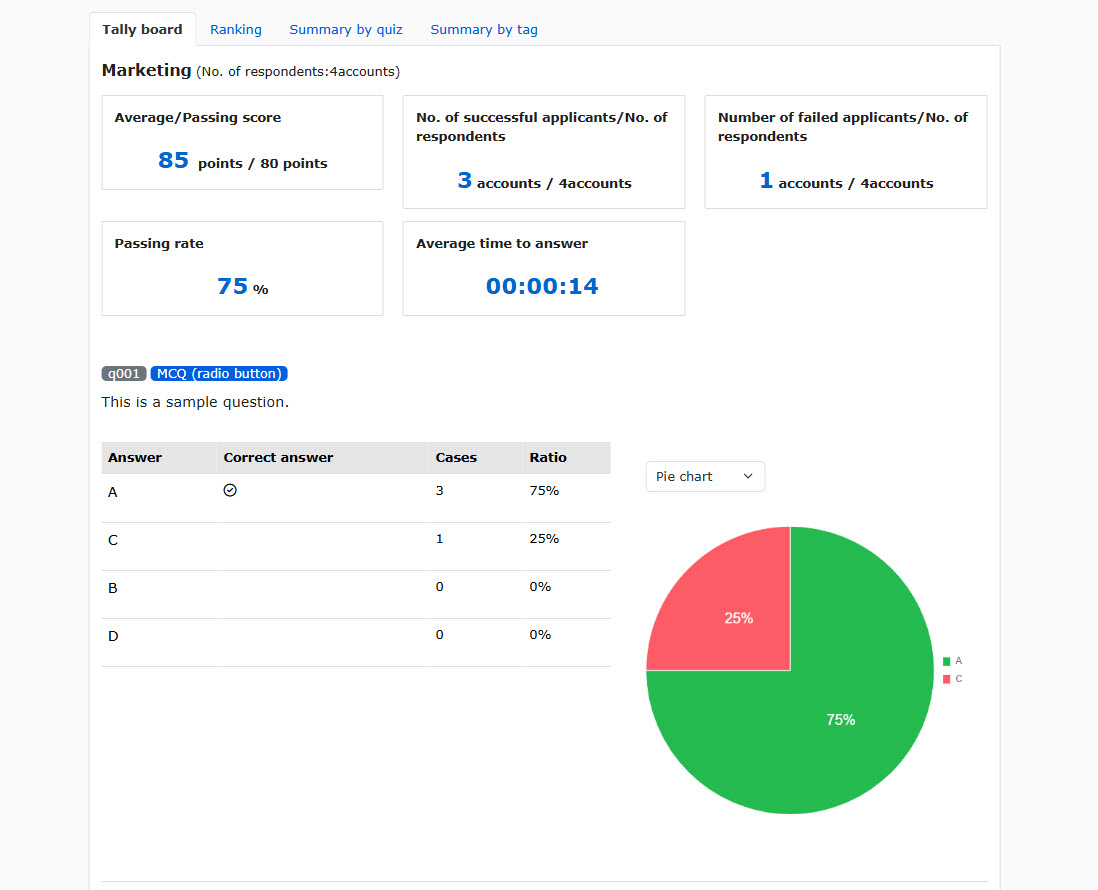
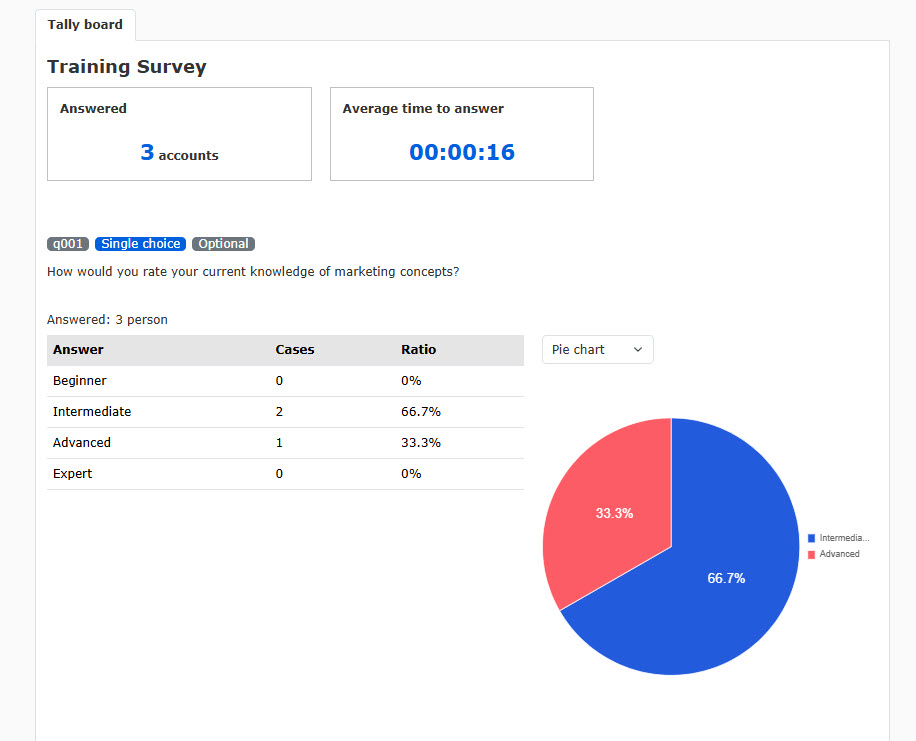
01. Tally board
Grade managers can check learners' results and answer details with tables and graphs.
The following are sample images.
Quiz/exam
This is valid only when the Normal mode is set in the option settings.
Questionnaire
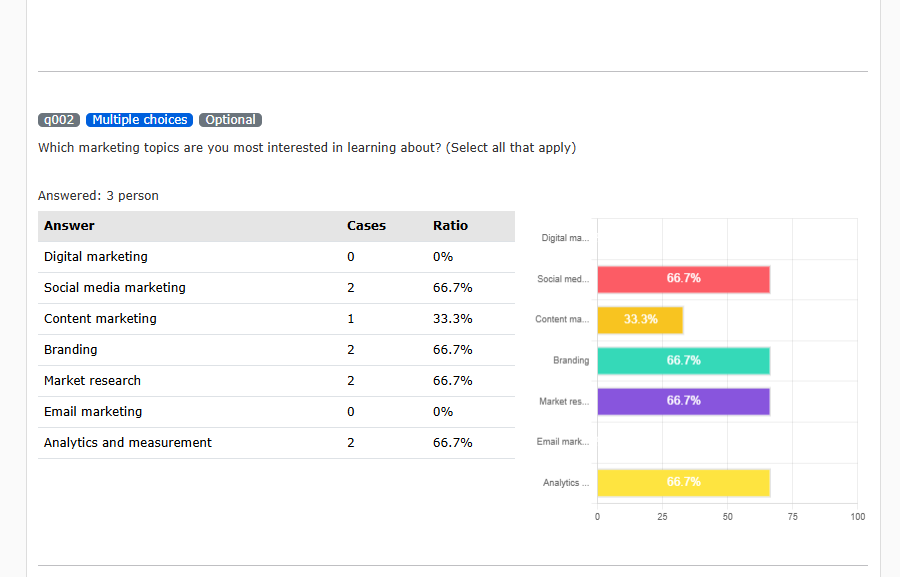
When the Single choice, Multiple choices or List is selected, the user interface will be displayed as follows.
*Only bar graphs will be available for multiple choices.
The following graph will be applied when the answer format is Single line or Multiple lines.
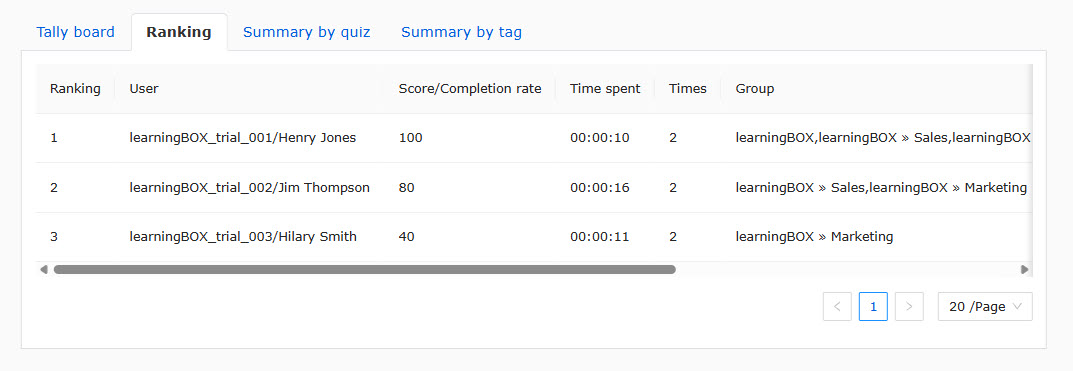
02. Ranking
Each learner's score and time spent will be displayed in a ranking format.
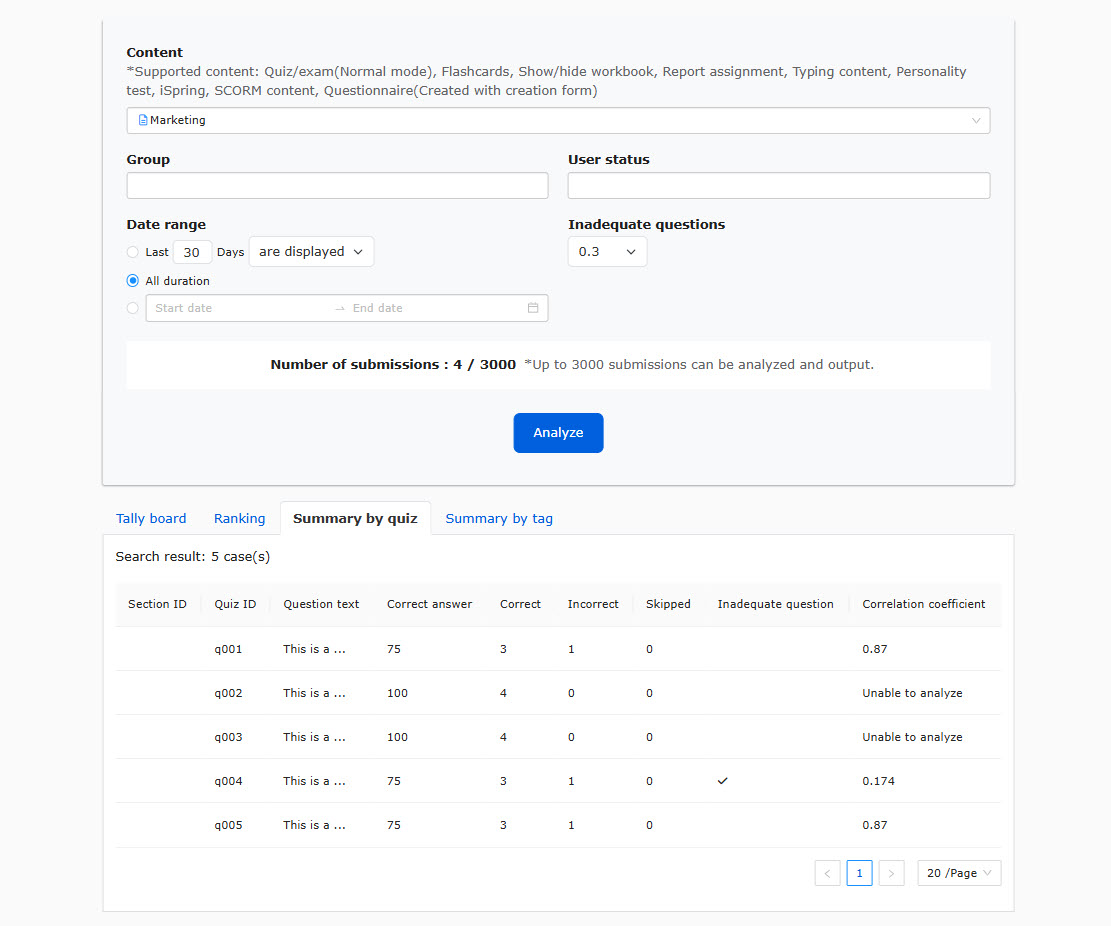
03. Summary by quiz
Number of correct and incorrect answers will be displayed.
Also, you can find bad quizzes by the setting.
Set the values between -1 and 1. When the result is below the value, the question will be identified as a bad question.
To use this function, select value in the search field and click on Analayze.
When a question is identified as a bad question, ✔ will be marked in the table.
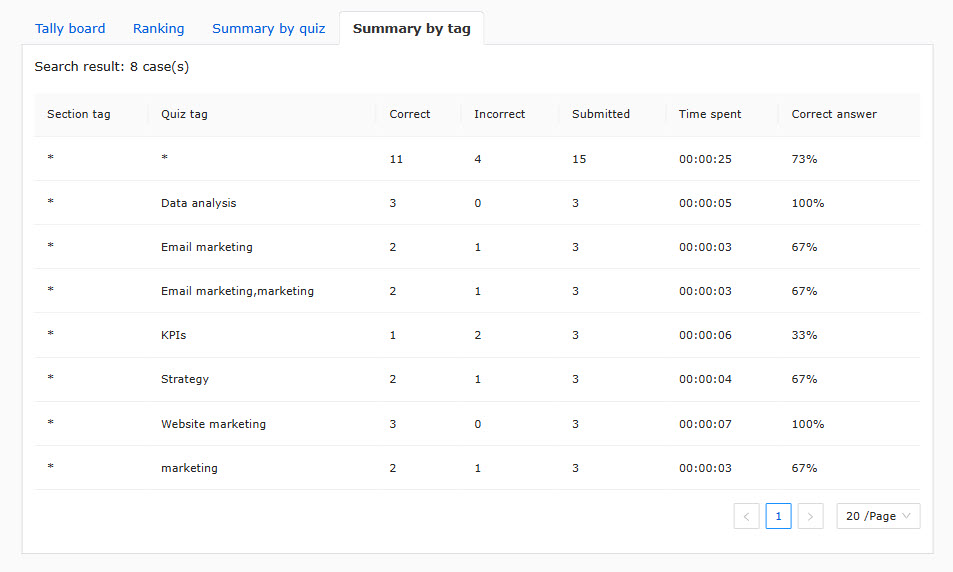
04. Summary by tag
According to the tags you have set, the detailed data regarding each tag will be displayed.
*For more details about tags, refer to Tags.