Tally board
Tally board shows learners' answers with a pie chart or bar graph.
Admins see overall trends, while learners can review their own strengths.
Required
Content Management Editing Authority (*when setting up a tally board)
How to set
There are three types of content for which aggregate boards can be set up
The following explain how to set a tally board on the quiz/exam.
- Quizzes/exams
- SCORM
- Questionnaire
01. Open the settings page
Select Manage contents in the side menu.
Create a quiz/exam.
Next, right-click on the quiz/test you created or select the "︙" icon > "Set Tally Board".
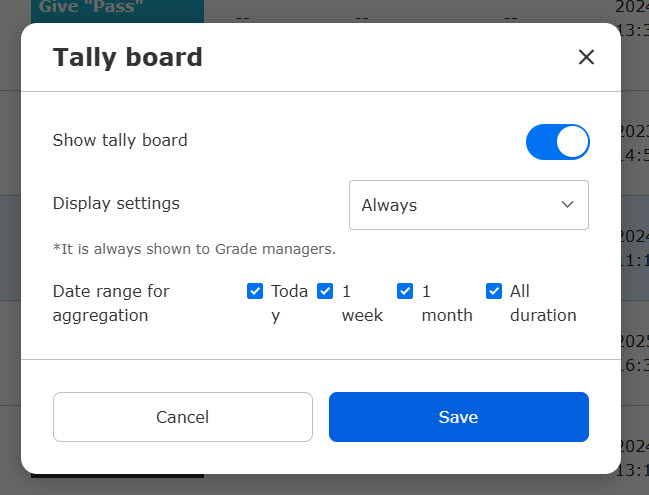
02. Settings
Turn on the toggle key next to "Show tally board."
Set the conditions with each toggle key.
Select one of the following from the "Display Settings" pull-down menu.
- Always display
- Show when answered
- Indicate if passed
Finally, please tick the desired display period (*multiple selections allowed).
Interface
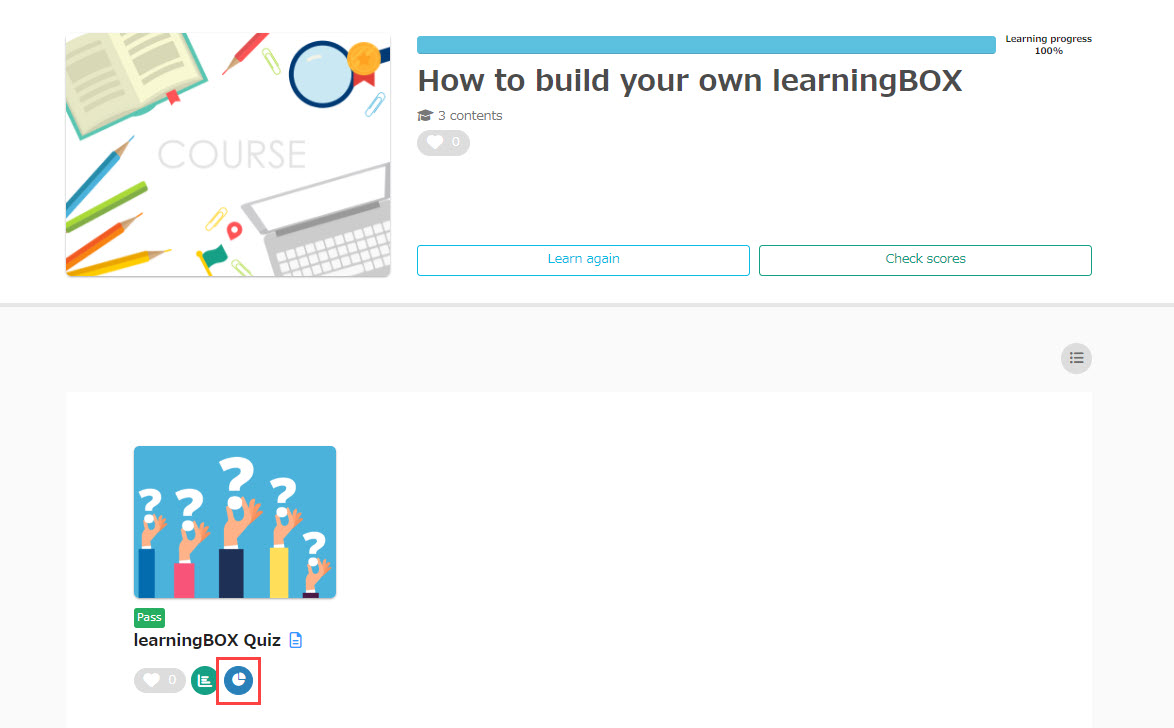
01. Icon
Tally boards will be displayed on the Select a course page.
When a tally board is set, you will see the icon under a content thumbnail.
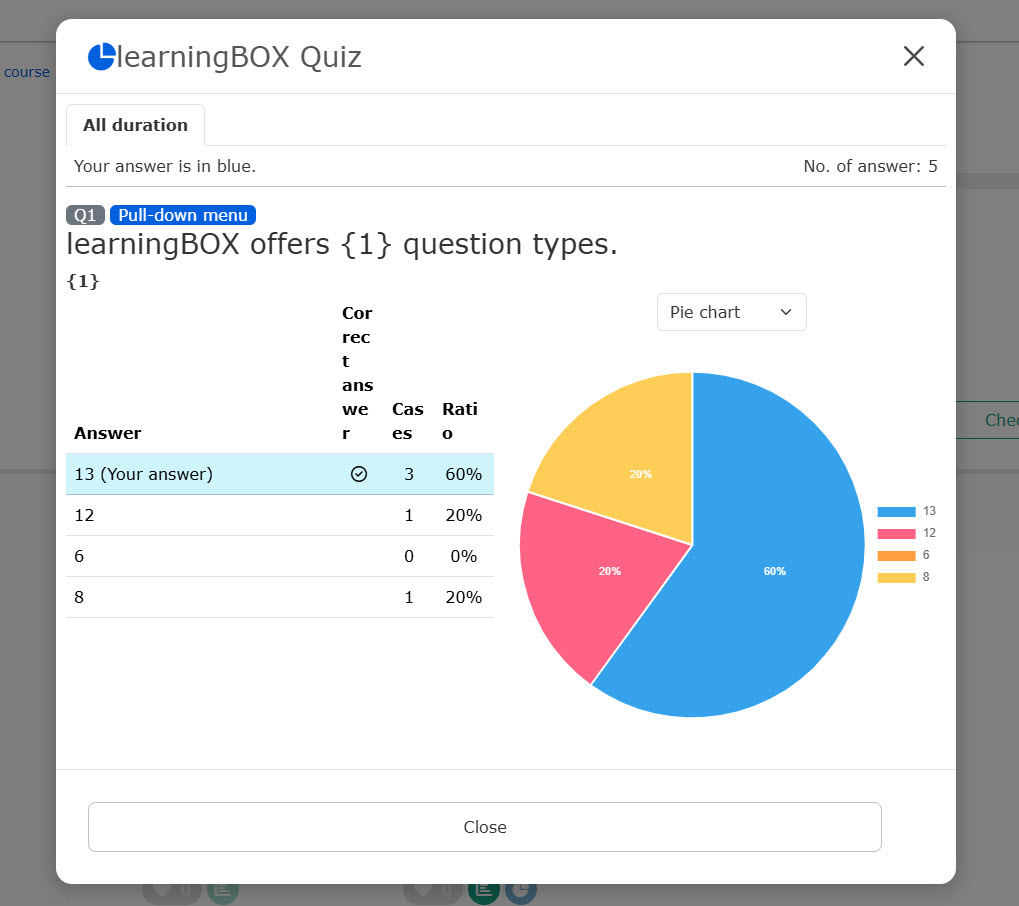
02. Interface
Submitted answer details will be displayed.
You can select a pie chart or bar chart from the list.
When multiple display periods are set, you can switch tabs at the top of the page.